Human Aquaporin 1,AQP-1 ELISA Kit
Product Details
| Target Name |
aquaporin 1 (Colton blood group) |
| Alternative Names |
AQP 1 ELISA Kit; AQP CHIP ELISA Kit; AQP-1 ELISA Kit; AQP1 ELISA Kit; AQP1_HUMAN ELISA Kit; aquaporin 1 (channel-forming integral protein; 28kDa; CO blood group) ELISA Kit; aquaporin 1 (Colton blood group) ELISA Kit; Aquaporin CHIP ELISA Kit; Aquaporin-1 ELISA Kit; Aquaporin-CHIP ELISA Kit; Aquaporin1 ELISA Kit; Channel forming integral protein 28kDa ELISA Kit; Channel like integral membrane protein 28 kDa ELISA Kit; CHIP 28 ELISA Kit; CHIP28 ELISA Kit; CO ELISA Kit; Colton blood group ELISA Kit; Growth factor induced delayed early response protein ELISA Kit; MGC26324 ELISA Kit; Urine water channel ELISA Kit; Water channel protein CHIP 29 ELISA Kit; Water channel protein CHIP29 ELISA Kit; Water channel protein for red blood cells and kidney proximal tubule ELISA Kit |
| Abbreviation |
AQP1 |
| Species |
Homo sapiens (Human) |
| Sample Types |
serum, plasma, cell culture supernates, cell lysates |
| Detection Range |
15.6 pg/mL-1000 pg/mL |
| Sensitivity |
3.9 pg/mL |
| Assay Time |
1-5h |
| Sample Volume |
50-100ul |
| Detection Wavelength |
450 nm |
| Research Area |
Signal Transduction |
| Assay Principle |
quantitative |
| Measurement |
Sandwich |
| Precision |
| Intra-assay Precision (Precision within an assay): CV% |
| Three samples of known concentration were tested twenty times on one plate to assess. |
|
| Inter-assay Precision (Precision between assays): CV% |
| Three samples of known concentration were tested in twenty assays to assess. |
|
|
| |
|
|
|
|
|
|
|
| Linearity |
| To assess the linearity of the assay, samples were spiked with high concentrations of human AQP-1 in various matrices and diluted with the Sample Diluent to produce samples with values within the dynamic range of the assay. |
| |
Sample |
Serum(n=4) |
|
| 1:1 |
Average % |
97 |
|
| Range % |
90-103 |
|
| 1:2 |
Average % |
94 |
|
| Range % |
88-100 |
|
| 1:4 |
Average % |
90 |
|
| Range % |
85-95 |
|
| 1:8 |
Average % |
93 |
|
| Range % |
87-99 |
|
|
| Recovery |
| The recovery of human AQP-1 spiked to levels throughout the range of the assay in various matrices was evaluated. Samples were diluted prior to assay as directed in the Sample Preparation section. |
| Sample Type |
Average % Recovery |
Range |
|
| Serum (n=5) |
89 |
82-95 |
|
| EDTA plasma (n=4) |
98 |
95-102 |
|
| |
|
|
|
|
|
|
| |
|
|
|
|
|
|
|
| Typical Data |
| These standard curves are provided for demonstration only. A standard curve should be generated for each set of samples assayed. |
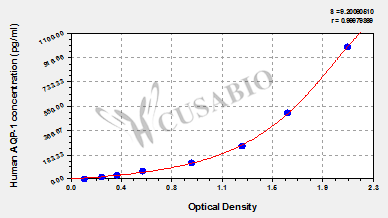
| pg/ml |
OD1 |
OD2 |
Average |
Corrected |
|
| 1000 |
2.070 |
2.055 |
2.063 |
1.955 |
|
| 500 |
1.650 |
1.592 |
1.621 |
1.513 |
|
| 250 |
1.286 |
1.278 |
1.282 |
1.174 |
|
| 125 |
0.887 |
0.925 |
0.906 |
0.798 |
|
| 62.5 |
0.521 |
0.563 |
0.542 |
0.434 |
|
| 31.2 |
0.362 |
0.345 |
0.354 |
0.246 |
|
| 15.6 |
0.245 |
0.235 |
0.240 |
0.132 |
|
| 0 |
0.112 |
0.103 |
0.108 |
|
|
|
|
| Storage |
Store at 2-8°C. Please refer to protocol. |
| Lead Time |
3-5 working days |