| Target Name |
V-set domain containing T cell activation inhibitor 1 |
| Alternative Names |
B7 family member, H4 ELISA Kit; B7 H4 ELISA Kit; B7 homolog 4 ELISA Kit; B7 superfamily member 1 ELISA Kit; B7 superfamily, member 1 ELISA Kit; B7-H4 ELISA Kit; B7h.5 ELISA Kit; B7h4 ELISA Kit; B7S1 ELISA Kit; B7x ELISA Kit; BC032925 ELISA Kit; Immune costimulatory protein B7-H4 ELISA Kit; Immune costimulatory protein B7H4 ELISA Kit; MGC41287 ELISA Kit; PRO1291 ELISA Kit; Protein B7S1 ELISA Kit; RP11 229A19.4 ELISA Kit; T cell costimulatory molecule B7x ELISA Kit; T-cell costimulatory molecule B7x ELISA Kit; V set domain-containing T cell activation inhibitor 1 ELISA Kit; V-set domain-containing T-cell activation inhibitor 1 ELISA Kit; VCTN1 ELISA Kit; Vtcn1 ELISA Kit; VTCN1_HUMAN ELISA Kit |
| Abbreviation |
VTCN1 |
| Species |
Homo sapiens (Human) |
| Sample Types |
serum, plasma, cell culture supernates, tissue homogenates |
| Detection Range |
7.8 ng/mL-500 ng/mL |
| Sensitivity |
1.95 ng/mL |
| Assay Time |
1-5h |
| Sample Volume |
50-100ul |
| Detection Wavelength |
450 nm |
| Research Area |
Immunology |
| Assay Principle |
quantitative |
| Measurement |
Sandwich |
| Precision |
| Intra-assay Precision (Precision within an assay): CV% |
| Three samples of known concentration were tested twenty times on one plate to assess. |
|
| Inter-assay Precision (Precision between assays): CV% |
| Three samples of known concentration were tested in twenty assays to assess. |
|
|
| |
|
|
|
|
|
|
|
| Linearity |
| To assess the linearity of the assay, samples were spiked with high concentrations of human B7-H4 in various matrices and diluted with the Sample Diluent to produce samples with values within the dynamic range of the assay. |
| |
Sample |
Serum(n=4) |
|
| 1:1 |
Average % |
95 |
|
| Range % |
92-100 |
|
| 1:2 |
Average % |
90 |
|
| Range % |
82-97 |
|
| 1:4 |
Average % |
92 |
|
| Range % |
88-96 |
|
| 1:8 |
Average % |
87 |
|
| Range % |
82-98 |
|
|
| Recovery |
| The recovery of human B7-H4 spiked to levels throughout the range of the assay in various matrices was evaluated. Samples were diluted prior to assay as directed in the Sample Preparation section. |
| Sample Type |
Average % Recovery |
Range |
|
| Serum (n=5) |
90 |
85-97 |
|
| EDTA plasma (n=4) |
89 |
84-93 |
|
| |
|
|
|
|
|
|
| |
|
|
|
|
|
|
|
| Typical Data |
| These standard curves are provided for demonstration only. A standard curve should be generated for each set of samples assayed. |
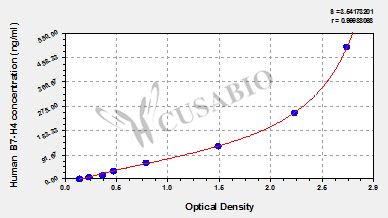
| ng/ml |
OD1 |
OD2 |
Average |
Corrected |
|
| 500 |
2.625 |
2.750 |
2.688 |
2.542 |
|
| 250 |
2.100 |
2.274 |
2.187 |
2.041 |
|
| 125 |
1.466 |
1.463 |
1.465 |
1.319 |
|
| 62.5 |
0.759 |
0.797 |
0.778 |
0.632 |
|
| 31.25 |
0.475 |
0.461 |
0.468 |
0.322 |
|
| 15.6 |
0.362 |
0.366 |
0.364 |
0.218 |
|
| 7.8 |
0.231 |
0.245 |
0.238 |
0.092 |
|
| 0 |
0.142 |
0.150 |
0.146 |
|
|
|
|
| Storage |
Store at 2-8°C. Please refer to protocol. |
| Lead Time |
3-5 working days |