Human fibroblast growth factor-13,FGF-13 ELISA Kit
Product Details
| Target Name |
fibroblast growth factor 13 |
| Alternative Names |
FGF 13 ELISA Kit; FGF 2 ELISA Kit; FGF-13 ELISA Kit; FGF13 ELISA Kit; FGF13_HUMAN ELISA Kit; FGF2 ELISA Kit; FHF 2 ELISA Kit; FHF-2 ELISA Kit; FHF2 ELISA Kit; Fibroblast growth factor 13 ELISA Kit; Fibroblast growth factor homologous factor 2 ELISA Kit; OTTHUMP00000024143 ELISA Kit; OTTHUMP00000024144 ELISA Kit |
| Abbreviation |
FGF13 |
| Species |
Homo sapiens (Human) |
| Sample Types |
serum, plasma, cell culture supernates |
| Detection Range |
12.5 pg/mL-800 pg/mL |
| Sensitivity |
3.12 pg/mL |
| Assay Time |
1-5h |
| Sample Volume |
50-100ul |
| Detection Wavelength |
450 nm |
| Research Area |
Signal Transduction |
| Assay Principle |
quantitative |
| Measurement |
Sandwich |
| Precision |
| Intra-assay Precision (Precision within an assay): CV% |
|
|
|
|
| Three samples of known concentration were tested twenty times on one plate to assess. |
|
|
| Inter-assay Precision (Precision between assays): CV% |
|
|
|
|
| Three samples of known concentration were tested in twenty assays to assess. |
|
|
|
| |
|
|
|
|
|
|
|
|
| Linearity |
| To assess the linearity of the assay, samples were spiked with high concentrations of human FGF-13 in various matrices and diluted with the Sample Diluent to produce samples with values within the dynamic range of the assay. |
|
| |
Sample |
Serum(n=4) |
|
|
| 1:1 |
Average % |
85 |
|
|
| Range % |
80-90 |
|
|
| 1:2 |
Average % |
96 |
|
|
| Range % |
92-100 |
|
|
| 1:4 |
Average % |
90 |
|
|
| Range % |
85-94 |
|
|
| 1:8 |
Average % |
92 |
|
|
| Range % |
88-96 |
|
|
|
| Recovery |
| The recovery of human FGF-13 spiked to levels throughout the range of the assay in various matrices was evaluated. Samples were diluted prior to assay as directed in the Sample Preparation section. |
|
| |
| Sample Type |
Average % Recovery |
Range |
|
|
| Serum (n=5) |
88 |
84-92 |
|
|
| EDTA plasma (n=4) |
104 |
100-109 |
|
|
| |
|
|
|
|
|
|
|
| |
|
|
|
|
|
|
|
|
| Typical Data |
| These standard curves are provided for demonstration only. A standard curve should be generated for each set of samples assayed. |
|
| |
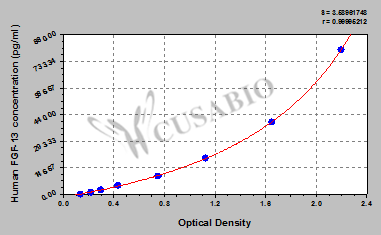
| pg/ml |
OD1 |
OD2 |
Average |
Corrected |
|
|
| 800 |
2.152 |
2.263 |
2.208 |
2.062 |
|
|
| 400 |
1.607 |
1.712 |
1.660 |
1.514 |
|
|
| 200 |
1.179 |
1.096 |
1.138 |
0.992 |
|
|
| 100 |
0.781 |
0.745 |
0.763 |
0.617 |
|
|
| 50 |
0.435 |
0.451 |
0.443 |
0.297 |
|
|
| 25 |
0.314 |
0.307 |
0.311 |
0.165 |
|
|
| 12.5 |
0.228 |
0.234 |
0.231 |
0.085 |
|
|
| 0 |
0.143 |
0.149 |
0.146 |
|
|
|
|
|
| Storage |
Store at 2-8°C. Please refer to protocol. |
| Lead Time |
3-5 working days |