Human fibroblast growth factor-23,FGF-23 ELISA Kit
Product Details
| Target Name |
fibroblast growth factor 23 |
| Alternative Names |
ADHR ELISA Kit; FGF-23 ELISA Kit; Fgf23 ELISA Kit; FGF23_HUMAN ELISA Kit; FGFN ELISA Kit; Fibroblast growth factor 23 ELISA Kit; Fibroblast growth factor 23 C-terminal peptide ELISA Kit; Fibroblast growth factor 23 precursor ELISA Kit; HPDR2 ELISA Kit; HYPF ELISA Kit; Phosphatonin ELISA Kit; PHPTC ELISA Kit; Tumor derived hypophosphatemia inducing factor ELISA Kit; Tumor-derived hypophosphatemia-inducing factor ELISA Kit |
| Abbreviation |
FGF23 |
| Species |
Homo sapiens (Human) |
| Sample Types |
serum, cell culture supernates, urine, tissue homogenates |
| Detection Range |
3.12 pg/mL-200 pg/mL |
| Sensitivity |
0.78 pg/mL |
| Assay Time |
1-5h |
| Sample Volume |
50-100ul |
| Detection Wavelength |
450 nm |
| Research Area |
Signal Transduction |
| Assay Principle |
quantitative |
| Measurement |
Sandwich |
| Precision |
| Intra-assay Precision (Precision within an assay): CV% |
| Three samples of known concentration were tested twenty times on one plate to assess. |
|
| Inter-assay Precision (Precision between assays): CV% |
| Three samples of known concentration were tested in twenty assays to assess. |
|
|
| |
|
|
|
|
|
|
|
| Linearity |
| To assess the linearity of the assay, samples were spiked with high concentrations of human FGF-23 in various matrices and diluted with the Sample Diluent to produce samples with values within the dynamic range of the assay. |
| |
Sample |
Serum(n=4) |
|
| 1:1 |
Average % |
99 |
|
| Range % |
80-115 |
|
| 1:2 |
Average % |
100 |
|
| Range % |
91-110 |
|
| 1:4 |
Average % |
97 |
|
| Range % |
92-115 |
|
| 1:8 |
Average % |
93 |
|
| Range % |
86-100 |
|
|
| Recovery |
| The recovery of human FGF-23 spiked to levels throughout the range of the assay in various matrices was evaluated. Samples were diluted prior to assay as directed in the Sample Preparation section. |
| Sample Type |
Average % Recovery |
Range |
|
| Serum (n=5) |
95 |
89-100 |
|
| |
|
|
|
|
|
|
| |
|
|
|
|
|
|
|
| Typical Data |
| These standard curves are provided for demonstration only. A standard curve should be generated for each set of samples assayed. |
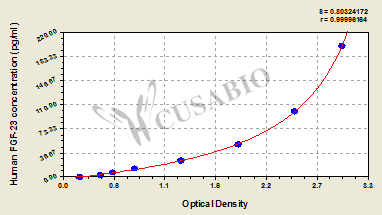
| pg/ml |
OD1 |
OD2 |
Average |
Corrected |
|
| 200 |
2.958 |
2.986 |
2.972 |
2.783 |
|
| 100 |
2.461 |
2.475 |
2.468 |
2.279 |
|
| 50 |
1.852 |
1.889 |
1.871 |
1.682 |
|
| 25 |
1.234 |
1.286 |
1.260 |
1.071 |
|
| 12.5 |
0.753 |
0.786 |
0.770 |
0.581 |
|
| 6.25 |
0.531 |
0.556 |
0.544 |
0.355 |
|
| 3.12 |
0.396 |
0.416 |
0.406 |
0.217 |
|
| 0 |
0.192 |
0.186 |
0.189 |
|
|
|
|
| Storage |
Store at 2-8°C. Please refer to protocol. |
| Lead Time |
3-5 working days |