Human Galectin 7(Gal-7) ELISA Kit
Product Details
| Alternative Names |
Gal-7 ELISA Kit; GAL7 ELISA Kit; Galectin 7B ELISA Kit; Galectin-7 ELISA Kit; HKL-14 ELISA Kit; Human keratinocyte lectin 14 ELISA Kit; Keratinocyte lectin 14 ELISA Kit; Lectin galactoside binding soluble 7 ELISA Kit; Lectin; galactoside binding; soluble; 7B ELISA Kit; LEG7_HUMAN ELISA Kit; LGALS7 ELISA Kit; LGALS7A ELISA Kit; LGALS7B ELISA Kit; P53 induced protein 1 ELISA Kit; p53-induced gene 1 protein ELISA Kit; Pi7 ELISA Kit; PIG1 ELISA Kit; TP53I1 ELISA Kit |
| Abbreviation |
Gal-7 |
| Species |
Homo sapiens (Human) |
| Sample Types |
serum, plasma, tissue homogenates |
| Detection Range |
78 pg/mL-5000 pg/mL |
| Sensitivity |
19.5 pg/mL |
| Assay Time |
1-5h |
| Sample Volume |
50-100ul |
| Detection Wavelength |
450 nm |
| Research Area |
Cancer |
| Precision |
| Intra-assay Precision (Precision within an assay): CV% |
|
|
|
|
| Three samples of known concentration were tested twenty times on one plate to assess. |
|
|
| Inter-assay Precision (Precision between assays): CV% |
|
|
|
|
| Three samples of known concentration were tested in twenty assays to assess. |
|
|
|
| |
|
|
|
|
|
|
|
|
| Linearity |
| To assess the linearity of the assay, samples were spiked with high concentrations of human Gal-7 in various matrices and diluted with the Sample Diluent to produce samples with values within the dynamic range of the assay. |
|
| |
Sample |
Serum(n=4) |
|
|
| 1:1 |
Average % |
91 |
|
|
| Range % |
88-96 |
|
|
| 1:2 |
Average % |
95 |
|
|
| Range % |
90-102 |
|
|
| 1:4 |
Average % |
97 |
|
|
| Range % |
94-104 |
|
|
| 1:8 |
Average % |
101 |
|
|
| Range % |
95-105 |
|
|
|
| Recovery |
| The recovery of human Gal-7 spiked to levels throughout the range of the assay in various matrices was evaluated. Samples were diluted prior to assay as directed in the Sample Preparation section. |
|
| |
| Sample Type |
Average % Recovery |
Range |
|
|
| Serum (n=5) |
90 |
87-96 |
|
|
| EDTA plasma (n=4) |
98 |
95-103 |
|
|
| |
|
|
|
|
|
|
|
| |
|
|
|
|
|
|
|
|
| Typical Data |
| These standard curves are provided for demonstration only. A standard curve should be generated for each set of samples assayed. |
|
| |
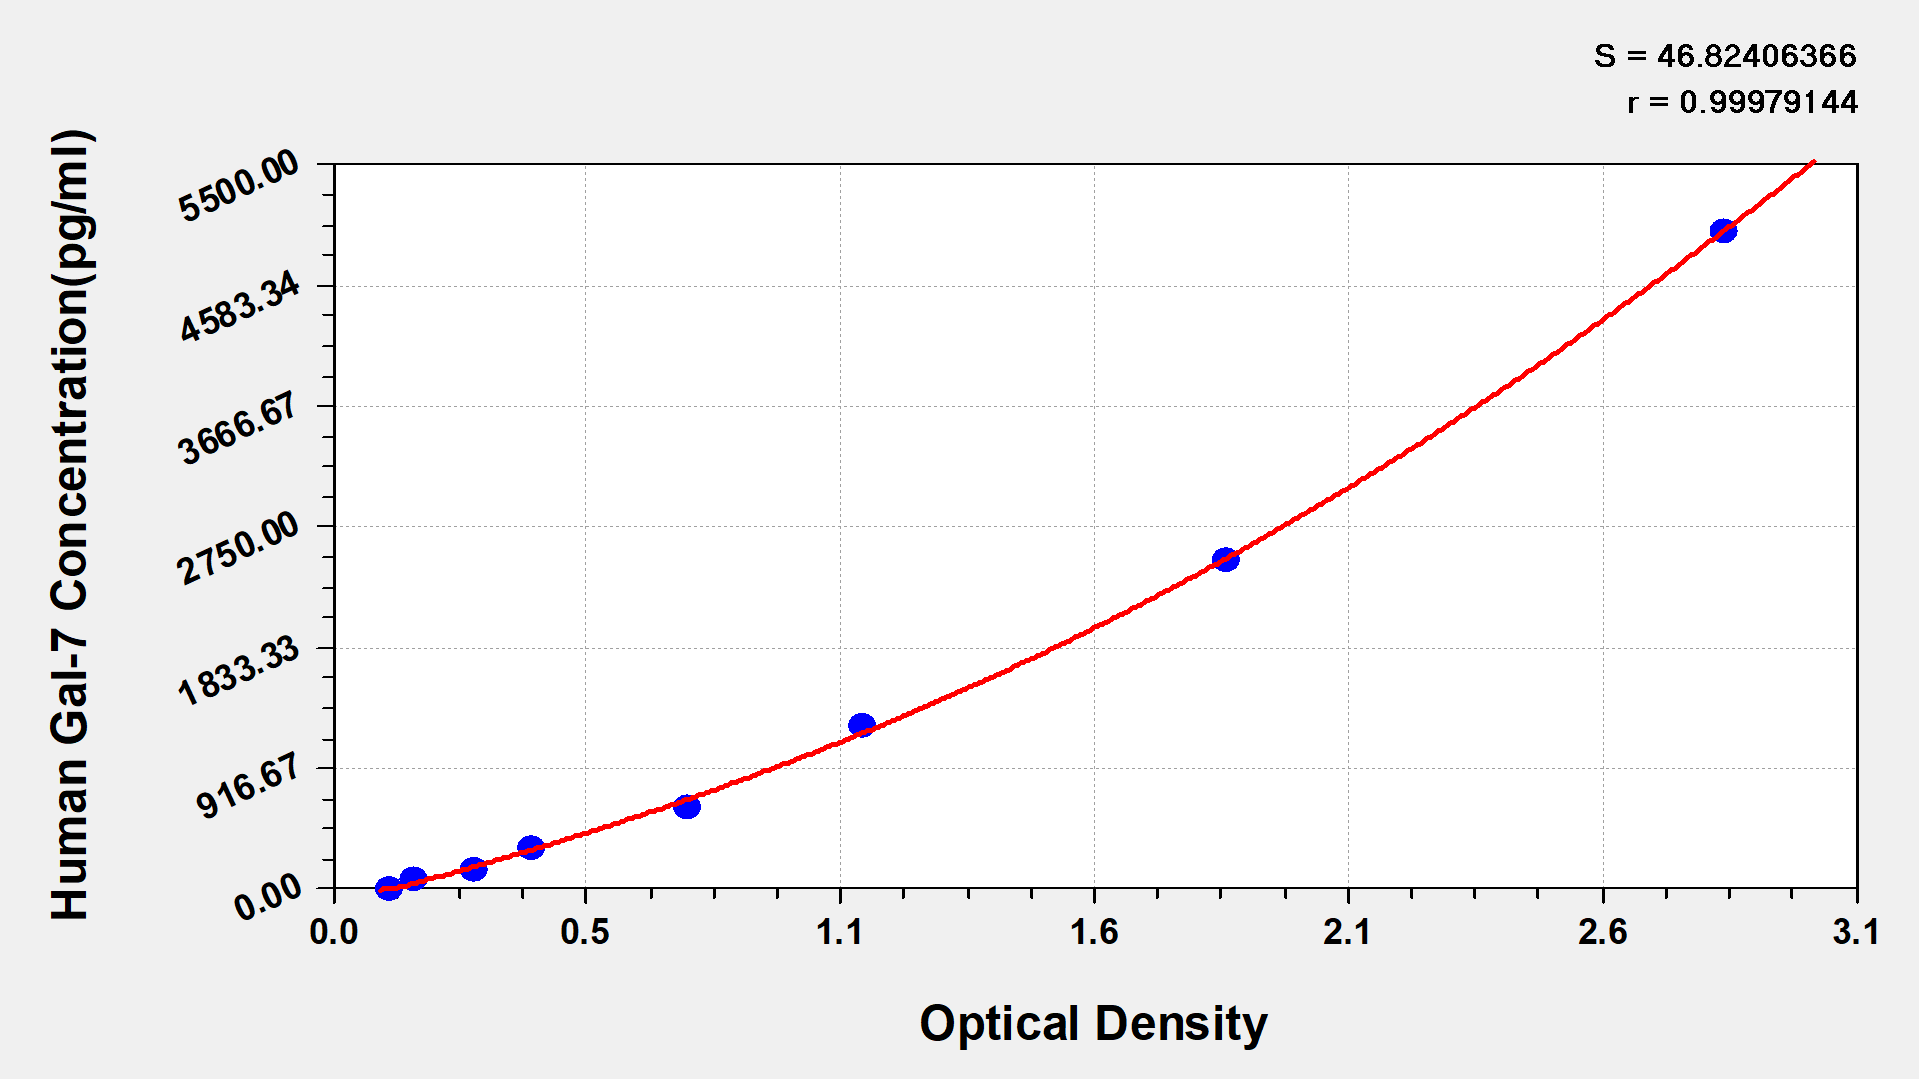
| pg/ml |
OD1 |
OD2 |
Average |
Corrected |
|
|
| 5000 |
2.819 |
2.910 |
2.865 |
2.739 |
|
|
| 2500 |
1.857 |
1.830 |
1.844 |
1.718 |
|
|
| 1250 |
1.140 |
1.057 |
1.099 |
0.973 |
|
|
| 625 |
0.750 |
0.729 |
0.740 |
0.614 |
|
|
| 312.5 |
0.422 |
0.422 |
0.422 |
0.296 |
|
|
| 156 |
0.291 |
0.311 |
0.301 |
0.175 |
|
|
| 78 |
0.183 |
0.177 |
0.180 |
0.054 |
|
|
| 0 |
0.123 |
0.129 |
0.126 |
|
|
|
|
|
| Storage |
Store at 2-8°C. Please refer to protocol. |
| Lead Time |
3-5 working days |