Human Galectin-9(LGALS9) ELISA kit
Product Details
| Target Name |
lectin, galactoside-binding, soluble, 9 |
| Alternative Names |
36 kDa beta-galactoside-binding lectin ELISA Kit; Ecalectin ELISA Kit; Gal-9 ELISA Kit; galectin 9 ELISA Kit; Galectin-9 ELISA Kit; galectin9 ELISA Kit; HOM HD 21 ELISA Kit; HOMHD21 ELISA Kit; HUAT ELISA Kit; Lectin galactoside binding soluble 9 ELISA Kit; LEG9_HUMAN ELISA Kit; LGAL S9 ELISA Kit; LGALS 9 ELISA Kit; Lgals9 ELISA Kit; LGALS9A ELISA Kit; MGC117375 ELISA Kit; MGC125973 ELISA Kit; MGC125974 ELISA Kit; Tumor antigen HOM-HD-21 ELISA Kit; UAT ELISA Kit; Urate transporter/channel ELISA Kit; Urate transporter/channel protein ELISA Kit |
| Abbreviation |
LGALS9 |
| Species |
Homo sapiens (Human) |
| Sample Types |
serum, plasma, cell culture supernates, tissue homogenates |
| Detection Range |
31.25 pg/mL-2000 pg/mL |
| Sensitivity |
7.8 pg/mL |
| Assay Time |
1-5h |
| Sample Volume |
50-100ul |
| Detection Wavelength |
450 nm |
| Research Area |
Cell Biology |
| Assay Principle |
quantitative |
| Measurement |
Sandwich |
| Precision |
| Intra-assay Precision (Precision within an assay): CV% |
| Three samples of known concentration were tested twenty times on one plate to assess. |
|
| Inter-assay Precision (Precision between assays): CV% |
| Three samples of known concentration were tested in twenty assays to assess. |
|
|
| |
|
|
|
|
|
|
|
| Linearity |
| To assess the linearity of the assay, samples were spiked with high concentrations of human LGALS9 in various matrices and diluted with the Sample Diluent to produce samples with values within the dynamic range of the assay. |
| |
Sample |
Serum(n=4) |
|
| 1:1 |
Average % |
92 |
|
| Range % |
86-97 |
|
| 1:2 |
Average % |
100 |
|
| Range % |
95-104 |
|
| 1:4 |
Average % |
88 |
|
| Range % |
83-94 |
|
| 1:8 |
Average % |
94 |
|
| Range % |
87-99 |
|
|
| Recovery |
| The recovery of human LGALS9 spiked to levels throughout the range of the assay in various matrices was evaluated. Samples were diluted prior to assay as directed in the Sample Preparation section. |
| Sample Type |
Average % Recovery |
Range |
|
| Serum (n=5) |
88 |
83-93 |
|
| EDTA plasma (n=4) |
96 |
92-101 |
|
| |
|
|
|
|
|
|
| |
|
|
|
|
|
|
|
| Typical Data |
| These standard curves are provided for demonstration only. A standard curve should be generated for each set of samples assayed. |
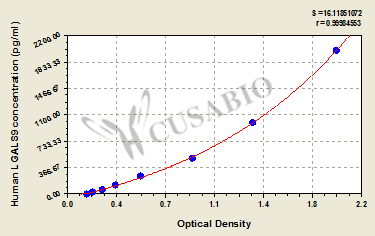
| pg/ml |
OD1 |
OD2 |
Average |
Corrected |
|
| 2000 |
1.987 |
1.952 |
1.970 |
1.814 |
|
| 1000 |
1.345 |
1.376 |
1.361 |
1.205 |
|
| 500 |
0.942 |
0.904 |
0.923 |
0.767 |
|
| 250 |
0.553 |
0.539 |
0.546 |
0.390 |
|
| 125 |
0.355 |
0.372 |
0.364 |
0.208 |
|
| 62.5 |
0.261 |
0.277 |
0.269 |
0.113 |
|
| 31.25 |
0.202 |
0.189 |
0.196 |
0.040 |
|
| 0 |
0.157 |
0.155 |
0.156 |
|
|
|
|
| Storage |
Store at 2-8°C. Please refer to protocol. |
| Lead Time |
7-14 working days |