Human glucose-6-phosphate isomerase,GPI ELISA Kit
Product Details
| Target Name |
glucose phosphate isomerase |
| Alternative Names |
AMF ELISA Kit; Aurocrine motility factor ELISA Kit; Autocrine motility factor ELISA Kit; DKFZp686C13233 ELISA Kit; EC 5.3.1.9 ELISA Kit; G6PI_HUMAN ELISA Kit; Glucose phosphate isomerase ELISA Kit; Glucose-6-phosphate isomerase ELISA Kit; GNPI ELISA Kit; GPI ELISA Kit; Gpi1 ELISA Kit; Hexose monophosphate isomerase ELISA Kit; Hexosephosphate isomerase ELISA Kit; Neuroleukin ELISA Kit; NLK ELISA Kit; Oxoisomerase ELISA Kit; PGI ELISA Kit; PHI ELISA Kit; Phosphoglucose isomerase ELISA Kit; Phosphohexomutase ELISA Kit; Phosphohexose isomerase ELISA Kit; Phosphosaccharomutase ELISA Kit; SA 36 ELISA Kit; SA-36 ELISA Kit; SA36 ELISA Kit; Sperm antigen 36 ELISA Kit |
| Abbreviation |
GPI |
| Species |
Homo sapiens (Human) |
| Sample Types |
serum, plasma, tissue homogenates |
| Detection Range |
12.5 ng/mL-800 ng/mL |
| Sensitivity |
3.12 ng/mL |
| Assay Time |
1-5h |
| Sample Volume |
50-100ul |
| Detection Wavelength |
450 nm |
| Research Area |
Metabolism |
| Assay Principle |
quantitative |
| Measurement |
Sandwich |
| Precision |
| Intra-assay Precision (Precision within an assay): CV% |
| Three samples of known concentration were tested twenty times on one plate to assess. |
|
| Inter-assay Precision (Precision between assays): CV% |
| Three samples of known concentration were tested in twenty assays to assess. |
|
|
| |
|
|
|
|
|
|
|
| Linearity |
| To assess the linearity of the assay, samples were spiked with high concentrations of human GPI in various matrices and diluted with the Sample Diluent to produce samples with values within the dynamic range of the assay. |
| |
Sample |
Serum(n=4) |
|
| 1:1 |
Average % |
91 |
|
| Range % |
86-95 |
|
| 1:2 |
Average % |
102 |
|
| Range % |
97-107 |
|
| 1:4 |
Average % |
91 |
|
| Range % |
85-97 |
|
| 1:8 |
Average % |
97 |
|
| Range % |
91-103 |
|
|
| Recovery |
| The recovery of human GPI spiked to levels throughout the range of the assay in various matrices was evaluated. Samples were diluted prior to assay as directed in the Sample Preparation section. |
| Sample Type |
Average % Recovery |
Range |
|
| Serum (n=5) |
91 |
84-95 |
|
| EDTA plasma (n=4) |
97 |
90-102 |
|
| |
|
|
|
|
|
|
| |
|
|
|
|
|
|
|
| Typical Data |
| These standard curves are provided for demonstration only. A standard curve should be generated for each set of samples assayed. |
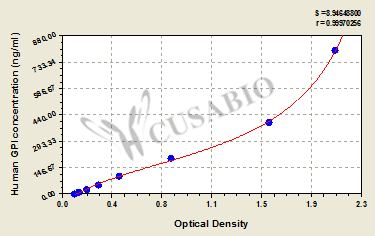
| ng/ml |
OD1 |
OD2 |
Average |
Corrected |
|
| 800 |
2.065 |
2.076 |
2.071 |
1.968 |
|
| 400 |
1.580 |
1.557 |
1.569 |
1.466 |
|
| 200 |
0.835 |
0.824 |
0.830 |
0.727 |
|
| 100 |
0.432 |
0.445 |
0.439 |
0.336 |
|
| 50 |
0.285 |
0.278 |
0.282 |
0.179 |
|
| 25 |
0.190 |
0.198 |
0.194 |
0.091 |
|
| 12.5 |
0.139 |
0.133 |
0.136 |
0.033 |
|
| 0 |
0.102 |
0.104 |
0.103 |
|
|
|
|
| Storage |
Store at 2-8°C. Please refer to protocol. |
| Lead Time |
3-5 working days |