Human Heat Shock Protein 60,HSP-60 ELISA Kit
Product Details
| Target Name |
heat shock 60kDa protein 1 (chaperonin) |
| Alternative Names |
60 kDa chaperonin ELISA Kit; 60 kDa heat shock protein; mitochondrial ELISA Kit; CH60_HUMAN ELISA Kit; Chaperonin 60 ELISA Kit; Chaperonin; 60-KD ELISA Kit; CPN60 ELISA Kit; fa04a05 ELISA Kit; GROEL ELISA Kit; heat shock 60kDa protein 1 (chaperonin) ELISA Kit; Heat shock protein 1 (chaperonin) ELISA Kit; Heat shock protein 60 ELISA Kit; Heat shock protein 65 ELISA Kit; heat shock protein family D (Hsp60) member 1 ELISA Kit; HLD4 ELISA Kit; Hsp 60 ELISA Kit; HSP 65 ELISA Kit; HSP-60 ELISA Kit; HSP60 ELISA Kit; HSP65 ELISA Kit; HSPD1 ELISA Kit; HuCHA60 ELISA Kit; Mitochondrial matrix protein P1 ELISA Kit; P60 lymphocyte protein ELISA Kit; short heat shock protein 60 Hsp60s1 ELISA Kit; SPG13 ELISA Kit |
| Abbreviation |
HSPD1 |
| Species |
Homo sapiens (Human) |
| Sample Types |
serum, plasma, tissue homogenates |
| Detection Range |
1.56 ng/mL-100 ng/mL |
| Sensitivity |
0.39 ng/mL |
| Assay Time |
1-5h |
| Sample Volume |
50-100ul |
| Detection Wavelength |
450 nm |
| Research Area |
Immunology |
| Assay Principle |
quantitative |
| Measurement |
Sandwich |
| Precision |
| Intra-assay Precision (Precision within an assay): CV% |
| Three samples of known concentration were tested twenty times on one plate to assess. |
|
| Inter-assay Precision (Precision between assays): CV% |
| Three samples of known concentration were tested in twenty assays to assess. |
|
|
| |
|
|
|
|
|
|
|
| Linearity |
| To assess the linearity of the assay, samples were spiked with high concentrations of human HSP-60 in various matrices and diluted with the Sample Diluent to produce samples with values within the dynamic range of the assay. |
| |
Sample |
Serum(n=4) |
|
| 1:1 |
Average % |
96 |
|
| Range % |
90-100 |
|
| 1:2 |
Average % |
93 |
|
| Range % |
88-99 |
|
| 1:4 |
Average % |
87 |
|
| Range % |
83-96 |
|
| 1:8 |
Average % |
90 |
|
| Range % |
86-84 |
|
|
| Recovery |
| The recovery of human HSP-60 spiked to levels throughout the range of the assay in various matrices was evaluated. Samples were diluted prior to assay as directed in the Sample Preparation section. |
| Sample Type |
Average % Recovery |
Range |
|
| Serum (n=5) |
87 |
82-90 |
|
| EDTA plasma (n=4) |
90 |
85-96 |
|
| |
|
|
|
|
|
|
| |
|
|
|
|
|
|
|
| Typical Data |
| These standard curves are provided for demonstration only. A standard curve should be generated for each set of samples assayed. |
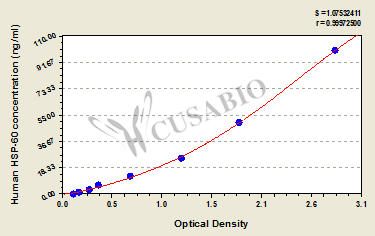
| ng/ml |
OD1 |
OD2 |
Average |
Corrected |
|
| 100 |
2.821 |
2.802 |
2.812 |
2.690 |
|
| 50 |
1.886 |
1.766 |
1.826 |
1.704 |
|
| 25 |
1.236 |
1.232 |
1.234 |
1.112 |
|
| 12.5 |
0.719 |
0.702 |
0.711 |
0.589 |
|
| 6.25 |
0.383 |
0.378 |
0.381 |
0.259 |
|
| 3.12 |
0.293 |
0.278 |
0.286 |
0.164 |
|
| 1.56 |
0.190 |
0.178 |
0.184 |
0.062 |
|
| 0 |
0.125 |
0.119 |
0.122 |
|
|
|
|
| Storage |
Store at 2-8°C. Please refer to protocol. |
| Lead Time |
3-5 working days |