Human insulin-like growth factors 1 receptor,IGF-1R ELISA Kit
Product Details
| Target Name |
insulin-like growth factor 1 receptor |
| Alternative Names |
CD221 ELISA Kit; CD221 antigen ELISA Kit; IGF 1 receptor ELISA Kit; IGF 1R ELISA Kit; IGF I receptor ELISA Kit; IGF-I receptor ELISA Kit; Igf1r ELISA Kit; IGF1R_HUMAN ELISA Kit; IGFIR ELISA Kit; IGFIRC ELISA Kit; IGFR ELISA Kit; Insulin like growth factor 1 receptor ELISA Kit; Insulin like growth factor 1 receptor precursor ELISA Kit; Insulin-like growth factor 1 receptor beta chain ELISA Kit; Insulin-like growth factor I receptor ELISA Kit; JTK13 ELISA Kit; MGC142170 ELISA Kit; MGC142172 ELISA Kit; MGC18216 ELISA Kit; Soluble IGF1R variant 1 ELISA Kit; Soluble IGF1R variant 2 ELISA Kit |
| Abbreviation |
IGF1R |
| Species |
Homo sapiens (Human) |
| Sample Types |
serum, plasma, tissue homogenates |
| Detection Range |
0.312 ng/mL-20 ng/mL |
| Sensitivity |
0.078 ng/mL |
| Assay Time |
1-5h |
| Sample Volume |
50-100ul |
| Detection Wavelength |
450 nm |
| Research Area |
Signal Transduction |
| Assay Principle |
quantitative |
| Measurement |
Sandwich |
| Precision |
| Intra-assay Precision (Precision within an assay): CV% |
| Three samples of known concentration were tested twenty times on one plate to assess. |
|
| Inter-assay Precision (Precision between assays): CV% |
| Three samples of known concentration were tested in twenty assays to assess. |
|
|
| |
|
|
|
|
|
|
|
| Linearity |
| To assess the linearity of the assay, samples were spiked with high concentrations of human IGF-1R in various matrices and diluted with the Sample Diluent to produce samples with values within the dynamic range of the assay. |
| |
Sample |
Serum(n=4) |
|
| 1:1 |
Average % |
91 |
|
| Range % |
86-95 |
|
| 1:2 |
Average % |
102 |
|
| Range % |
97-107 |
|
| 1:4 |
Average % |
91 |
|
| Range % |
85-97 |
|
| 1:8 |
Average % |
97 |
|
| Range % |
91-103 |
|
|
| Recovery |
| The recovery of human IGF-1R spiked to levels throughout the range of the assay in various matrices was evaluated. Samples were diluted prior to assay as directed in the Sample Preparation section. |
| Sample Type |
Average % Recovery |
Range |
|
| Serum (n=5) |
96 |
94-99 |
|
| EDTA plasma (n=4) |
95 |
89-99 |
|
| |
|
|
|
|
|
|
| |
|
|
|
|
|
|
|
| Typical Data |
| These standard curves are provided for demonstration only. A standard curve should be generated for each set of samples assayed. |
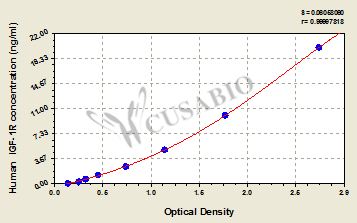
| ng/ml |
OD1 |
OD2 |
Average |
Corrected |
|
| 20 |
2.634 |
2.745 |
2.690 |
2.544 |
|
| 10 |
1.795 |
1.687 |
1.741 |
1.595 |
|
| 5 |
1.099 |
1.163 |
1.131 |
0.985 |
|
| 2.5 |
0.727 |
0.745 |
0.736 |
0.590 |
|
| 1.25 |
0.446 |
0.465 |
0.456 |
0.310 |
|
| 0.625 |
0.331 |
0.323 |
0.327 |
0.181 |
|
| 0.312 |
0.265 |
0.258 |
0.262 |
0.116 |
|
| 0 |
0.145 |
0.146 |
0.146 |
|
|
|
|
| Storage |
Store at 2-8°C. Please refer to protocol. |
| Lead Time |
3-5 working days |