Human insulin-like growth factors 1,IGF-1 ELISA Kit
Product Details
| Target Name |
insulin-like growth factors 1,IGF-1 |
| Alternative Names |
IBP1 ELISA Kit; IGF I ELISA Kit; IGF IA ELISA Kit; IGF IB ELISA Kit; IGF-I ELISA Kit; Igf1 ELISA Kit; IGF1_HUMAN ELISA Kit; IGF1A ELISA Kit; IGFI ELISA Kit; IGFIA ELISA Kit; Insulin like growth factor 1 (somatomedin C) ELISA Kit; Insulin like growth factor 1 ELISA Kit; Insulin like growth factor IA ELISA Kit; Insulin like growth factor IB ELISA Kit; Insulin-like growth factor I ELISA Kit; Mechano growth factor ELISA Kit; MGF ELISA Kit; OTTHUMP00000195080 ELISA Kit; OTTHUMP00000195081 ELISA Kit; OTTHUMP00000195082 ELISA Kit; OTTHUMP00000195083 ELISA Kit; OTTHUMP00000195084 ELISA Kit; Somatomedia C ELISA Kit; Somatomedin C ELISA Kit; Somatomedin-C ELISA Kit |
| Abbreviation |
IGF-1 |
| Species |
Homo sapiens (Human) |
| Sample Types |
serum, plasma, tissue homogenates |
| Detection Range |
7.8 ng/mL-500 ng/mL |
| Sensitivity |
1.95 ng/mL |
| Assay Time |
1-5h |
| Sample Volume |
50-100ul |
| Detection Wavelength |
450 nm |
| Research Area |
Signal Transduction |
| Assay Principle |
quantitative |
| Measurement |
Sandwich |
| Precision |
| Intra-assay Precision (Precision within an assay): CV% |
| Three samples of known concentration were tested twenty times on one plate to assess. |
|
| Inter-assay Precision (Precision between assays): CV% |
| Three samples of known concentration were tested in twenty assays to assess. |
|
|
| |
|
|
|
|
|
|
|
| Linearity |
| To assess the linearity of the assay, samples were spiked with high concentrations of human IGF-1 in various matrices and diluted with the Sample Diluent to produce samples with values within the dynamic range of the assay. |
| |
Sample |
Serum(n=4) |
|
| 1:1 |
Average % |
96 |
|
| Range % |
92-100 |
|
| 1:2 |
Average % |
102 |
|
| Range % |
99-105 |
|
| 1:4 |
Average % |
93 |
|
| Range % |
85-95 |
|
| 1:8 |
Average % |
98 |
|
| Range % |
94-101 |
|
|
| Recovery |
| The recovery of human IGF-1 spiked to levels throughout the range of the assay in various matrices was evaluated. Samples were diluted prior to assay as directed in the Sample Preparation section. |
| Sample Type |
Average % Recovery |
Range |
|
| Serum (n=5) |
93 |
91-95 |
|
| EDTA plasma (n=4) |
96 |
92-98 |
|
| |
|
|
|
|
|
|
| |
|
|
|
|
|
|
|
| Typical Data |
| These standard curves are provided for demonstration only. A standard curve should be generated for each set of samples assayed. |
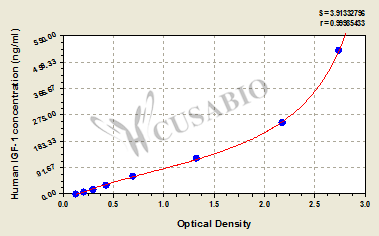
| ng/ml |
OD1 |
OD2 |
Average |
Corrected |
|
| 500 |
2.785 |
2.752 |
2.769 |
2.627 |
|
| 250 |
2.219 |
2.189 |
2.204 |
2.062 |
|
| 125 |
1.388 |
1.298 |
1.343 |
1.201 |
|
| 62.5 |
0.702 |
0.724 |
0.713 |
0.571 |
|
| 31.2 |
0.434 |
0.446 |
0.440 |
0.298 |
|
| 15.6 |
0.307 |
0.315 |
0.311 |
0.169 |
|
| 7.8 |
0.228 |
0.216 |
0.222 |
0.080 |
|
| 0 |
0.143 |
0.141 |
0.142 |
|
|
|
|
| Storage |
Store at 2-8°C. Please refer to protocol. |
| Lead Time |
3-5 working days |