Human insulin-like growth factors 2,IGF-2 ELISA Kit
Product Details
| Target Name |
insulin-like growth factor 2 (somatomedin A) |
| Alternative Names |
C11orf43 ELISA Kit; IGF 2 ELISA Kit; IGF II ELISA Kit; IGF-II ELISA Kit; IGF2 ELISA Kit; IGF2_HUMAN ELISA Kit; IGFII ELISA Kit; INSIGF ELISA Kit; insulin like growth factor 2 (somatomedin A) ELISA Kit; Insulin like Growth Factor 2 ELISA Kit; Insulin like growth factor II ELISA Kit; Insulin like growth factor II precursor ELISA Kit; Insulin like growth factor type 2 ELISA Kit; pp9974 ELISA Kit; Preptin ELISA Kit; putative insulin like growth factor II associated protein ELISA Kit; Somatomedin A ELISA Kit; Somatomedin-A ELISA Kit |
| Abbreviation |
IGF2 |
| Species |
Homo sapiens (Human) |
| Sample Types |
serum, plasma, cell culture supernates, urine, tissue homogenates |
| Detection Range |
62.5 pg/mL-4000 pg/mL |
| Sensitivity |
15.6 pg/mL |
| Assay Time |
1-5h |
| Sample Volume |
50-100ul |
| Detection Wavelength |
450 nm |
| Research Area |
Metabolism |
| Assay Principle |
quantitative |
| Measurement |
Sandwich |
| Precision |
| Intra-assay Precision (Precision within an assay): CV% |
| Three samples of known concentration were tested twenty times on one plate to assess. |
|
| Inter-assay Precision (Precision between assays): CV% |
| Three samples of known concentration were tested in twenty assays to assess. |
|
|
| |
|
|
|
|
|
|
|
| Linearity |
| To assess the linearity of the assay, samples were spiked with high concentrations of human IGF-2 in various matrices and diluted with the Sample Diluent to produce samples with values within the dynamic range of the assay. |
| |
Sample |
Serum(n=4) |
|
| 1:200 |
Average % |
84 |
|
| Range % |
80-92 |
|
| 1:400 |
Average % |
97 |
|
| Range % |
91-105 |
|
| 1:800 |
Average % |
97 |
|
| Range % |
92-104 |
|
| 1:1600 |
Average % |
93 |
|
| Range % |
86-98 |
|
|
| Recovery |
| The recovery of human IGF-2 spiked to levels throughout the range of the assay in various matrices was evaluated. Samples were diluted prior to assay as directed in the Sample Preparation section. |
| Sample Type |
Average % Recovery |
Range |
|
| Serum (n=5) |
95 |
89-104 |
|
| EDTA plasma (n=4) |
97 |
90-106 |
|
| |
|
|
|
|
|
|
| |
|
|
|
|
|
|
|
| Typical Data |
| These standard curves are provided for demonstration only. A standard curve should be generated for each set of samples assayed. |
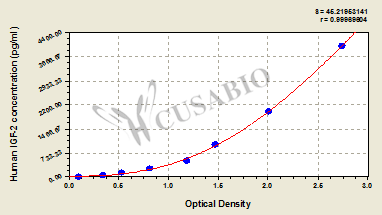
| pg/ml |
OD1 |
OD2 |
Average |
Corrected |
|
| 4000 |
2.789 |
2.769 |
2.779 |
2.673 |
|
| 2000 |
2.034 |
2.046 |
2.040 |
1.934 |
|
| 1000 |
1.518 |
1.478 |
1.498 |
1.392 |
|
| 500 |
1.205 |
1.206 |
1.206 |
1.100 |
|
| 250 |
0.823 |
0.839 |
0.831 |
0.725 |
|
| 125 |
0.536 |
0.546 |
0.541 |
0.435 |
|
| 62.5 |
0.349 |
0.369 |
0.359 |
0.253 |
|
| 0 |
0.102 |
0.110 |
0.106 |
|
|
|
|
| Storage |
Store at 2-8°C. Please refer to protocol. |
| Lead Time |
3-5 working days |