Human insulin-like growth factors binding protein 3,IGFBP-3 ELISA Kit
Product Details
| Target Name |
insulin-like growth factor binding protein 3 |
| Alternative Names |
Acid stable subunit of the 140 K IGF complex ELISA Kit; Binding protein 29 ELISA Kit; Binding protein 53 ELISA Kit; BP 53 ELISA Kit; BP53 ELISA Kit; Growth hormone dependent binding protein ELISA Kit; IBP 3 ELISA Kit; IBP-3 ELISA Kit; IBP3 ELISA Kit; IBP3_HUMAN ELISA Kit; IGF binding protein 3 ELISA Kit; IGF-binding protein 3 ELISA Kit; IGFBP 3 ELISA Kit; IGFBP-3 ELISA Kit; IGFBP3 ELISA Kit; Insulin Like Growth Factor Binding Protein 3 ELISA Kit; Insulin-like growth factor binding protein 3 precursor ELISA Kit; Insulin-like growth factor-binding protein 3 ELISA Kit |
| Abbreviation |
IGFBP3 |
| Species |
Homo sapiens (Human) |
| Sample Types |
serum, plasma, tissue homogenates |
| Detection Range |
0.78 ng/mL-50 ng/mL |
| Sensitivity |
0.195 ng/mL |
| Assay Time |
1-5h |
| Sample Volume |
50-100ul |
| Detection Wavelength |
450 nm |
| Research Area |
Signal Transduction |
| Assay Principle |
quantitative |
| Measurement |
Sandwich |
| Precision |
| Intra-assay Precision (Precision within an assay): CV% |
| Three samples of known concentration were tested twenty times on one plate to assess. |
|
| Inter-assay Precision (Precision between assays): CV% |
| Three samples of known concentration were tested in twenty assays to assess. |
|
|
| |
|
|
|
|
|
|
|
| Linearity |
| To assess the linearity of the assay, samples were spiked with high concentrations of human IGFBP-3 in various matrices and diluted with the Sample Diluent to produce samples with values within the dynamic range of the assay. |
| |
Sample |
Serum(n=4) |
|
| 1:10 |
Average % |
92 |
|
| Range % |
82-103 |
|
| 1:20 |
Average % |
95 |
|
| Range % |
91-99 |
|
| 1:40 |
Average % |
95 |
|
| Range % |
90-100 |
|
| 1:80 |
Average % |
91 |
|
| Range % |
85-100 |
|
|
| Recovery |
| The recovery of human IGFBP-3 spiked to levels throughout the range of the assay in various matrices was evaluated. Samples were diluted prior to assay as directed in the Sample Preparation section. |
| Sample Type |
Average % Recovery |
Range |
|
| Serum (n=5) |
98 |
92-106 |
|
| EDTA plasma (n=4) |
95 |
90-100 |
|
| |
|
|
|
|
|
|
| |
|
|
|
|
|
|
|
| Typical Data |
| These standard curves are provided for demonstration only. A standard curve should be generated for each set of samples assayed. |
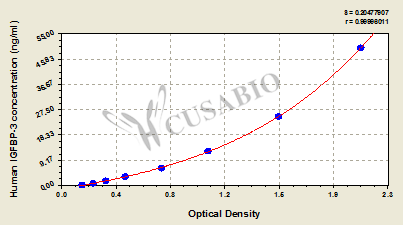
| ng/ml |
OD1 |
OD2 |
Average |
Corrected |
|
| 50 |
2.119 |
2.119 |
2.119 |
1.957 |
|
| 25 |
1.560 |
1.521 |
1.541 |
1.379 |
|
| 12.5 |
1.012 |
1.080 |
1.046 |
0.884 |
|
| 6.25 |
0.716 |
0.726 |
0.721 |
0.559 |
|
| 3.12 |
0.471 |
0.454 |
0.463 |
0.301 |
|
| 1.56 |
0.321 |
0.334 |
0.328 |
0.166 |
|
| 0.78 |
0.235 |
0.243 |
0.239 |
0.077 |
|
| 0 |
0.161 |
0.163 |
0.162 |
|
|
|
|
| Storage |
Store at 2-8°C. Please refer to protocol. |
| Lead Time |
3-5 working days |