Human Interleukin 2,IL-2 ELISA kit
Product Details
| Target Name |
interleukin 2 |
| Alternative Names |
Aldesleukin ELISA Kit; IL 2 ELISA Kit; IL-2 ELISA Kit; IL2 ELISA Kit; IL2_HUMAN ELISA Kit; Interleukin 2 ELISA Kit; Interleukin-2 ELISA Kit; interleukin2 ELISA Kit; Involved in regulation of T cell clonal expansion ELISA Kit; Lymphokine ELISA Kit; OTTHUMP00000164090 ELISA Kit; POIL2 ELISA Kit; T Cell Growth Factor ELISA Kit; T-cell growth factor ELISA Kit; TCGF ELISA Kit |
| Abbreviation |
IL2 |
| Species |
Homo sapiens (Human) |
| Sample Types |
serum, plasma, tissue homogenates |
| Detection Range |
3.12 pg/mL-200 pg/mL |
| Sensitivity |
0.78 pg/mL |
| Assay Time |
1-5h |
| Sample Volume |
50-100ul |
| Detection Wavelength |
450 nm |
| Research Area |
Immunology |
| Assay Principle |
quantitative |
| Measurement |
Sandwich |
| Precision |
| Intra-assay Precision (Precision within an assay): CV% |
| Three samples of known concentration were tested twenty times on one plate to assess. |
|
| Inter-assay Precision (Precision between assays): CV% |
| Three samples of known concentration were tested in twenty assays to assess. |
|
|
| |
|
|
|
|
|
|
|
| Linearity |
| To assess the linearity of the assay, samples were spiked with high concentrations of human IL-2 in various matrices and diluted with the Sample Diluent to produce samples with values within the dynamic range of the assay. |
| |
Sample |
Serum(n=4) |
|
| 1:1 |
Average % |
88 |
|
| Range % |
83-92 |
|
| 1:2 |
Average % |
102 |
|
| Range % |
98-105 |
|
| 1:4 |
Average % |
101 |
|
| Range % |
97-105 |
|
| 1:8 |
Average % |
95 |
|
| Range % |
90-98 |
|
|
| Recovery |
| The recovery of human IL-2 spiked to levels throughout the range of the assay in various matrices was evaluated. Samples were diluted prior to assay as directed in the Sample Preparation section. |
| Sample Type |
Average % Recovery |
Range |
|
| Serum (n=5) |
93 |
89-96 |
|
| EDTA plasma (n=4) |
96 |
90-99 |
|
| |
|
|
|
|
|
|
| |
|
|
|
|
|
|
|
| Typical Data |
| These standard curves are provided for demonstration only. A standard curve should be generated for each set of samples assayed. |
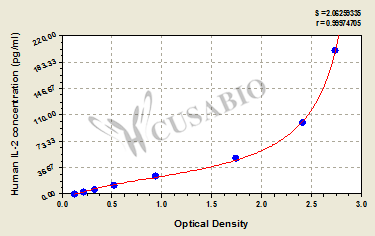
| pg/ml |
OD1 |
OD2 |
Average |
Corrected |
|
| 200 |
2.713 |
2.689 |
2.701 |
2.571 |
|
| 100 |
2.387 |
2.376 |
2.382 |
2.252 |
|
| 50 |
1.742 |
1.704 |
1.723 |
1.593 |
|
| 25 |
0.940 |
0.919 |
0.930 |
0.800 |
|
| 12.5 |
0.531 |
0.514 |
0.523 |
0.393 |
|
| 6.25 |
0.334 |
0.321 |
0.328 |
0.198 |
|
| 3.12 |
0.228 |
0.212 |
0.220 |
0.090 |
|
| 0 |
0.132 |
0.128 |
0.130 |
|
|
|
|
| Storage |
Store at 2-8°C. Please refer to protocol. |
| Lead Time |
3-5 working days |