Human Interleukin 3,IL-3 ELISA KIT
Product Details
| Target Name |
interleukin 3 (colony-stimulating factor, multiple) |
| Alternative Names |
Colony stimulating factor multiple ELISA Kit; Hematopoietic growth factor ELISA Kit; IL 3 ELISA Kit; IL-3 ELISA Kit; IL3 ELISA Kit; IL3_HUMAN ELISA Kit; Interleukin 3 (colony stimulating factor; multiple) ELISA Kit; Interleukin 3 ELISA Kit; Interleukin-3 ELISA Kit; Mast cell growth factor ELISA Kit; MCGF ELISA Kit; MGC79398 ELISA Kit; MGC79399 ELISA Kit; Multi CSF ELISA Kit; Multilineage colony stimulating factor ELISA Kit; Multipotential colony stimulating factor ELISA Kit; Multipotential colony-stimulating factor ELISA Kit; OTTHUMP00000065963 ELISA Kit; P cell stimulating factor ELISA Kit; P-cell-stimulating factor ELISA Kit |
| Abbreviation |
IL3 |
| Species |
Homo sapiens (Human) |
| Sample Types |
serum, plasma |
| Detection Range |
3.12 pg/mL-200 pg/mL |
| Sensitivity |
0.78 pg/mL |
| Assay Time |
1-5h |
| Sample Volume |
50-100ul |
| Detection Wavelength |
450 nm |
| Research Area |
Immunology |
| Assay Principle |
quantitative |
| Measurement |
Sandwich |
| Precision |
| Intra-assay Precision (Precision within an assay): CV% |
|
|
|
|
| Three samples of known concentration were tested twenty times on one plate to assess. |
|
|
| Inter-assay Precision (Precision between assays): CV% |
|
|
|
|
| Three samples of known concentration were tested in twenty assays to assess. |
|
|
|
| |
|
|
|
|
|
|
|
|
| Linearity |
| To assess the linearity of the assay, samples were spiked with high concentrations of human IL-3 in various matrices and diluted with the Sample Diluent to produce samples with values within the dynamic range of the assay. |
|
| |
Sample |
Serum(n=4) |
|
|
| 1:1 |
Average % |
94 |
|
|
| Range % |
85-98 |
|
|
| 1:2 |
Average % |
103 |
|
|
| Range % |
91-108 |
|
|
| 1:4 |
Average % |
92 |
|
|
| Range % |
87-95 |
|
|
| 1:8 |
Average % |
98 |
|
|
| Range % |
90-101 |
|
|
|
| Recovery |
| The recovery of human IL-3 spiked to levels throughout the range of the assay in various matrices was evaluated. Samples were diluted prior to assay as directed in the Sample Preparation section. |
|
| |
| Sample Type |
Average % Recovery |
Range |
|
|
| Serum (n=5) |
101 |
91-106 |
|
|
| EDTA plasma (n=4) |
100 |
92-104 |
|
|
| |
|
|
|
|
|
|
|
| |
|
|
|
|
|
|
|
|
| Typical Data |
| These standard curves are provided for demonstration only. A standard curve should be generated for each set of samples assayed. |
|
| |
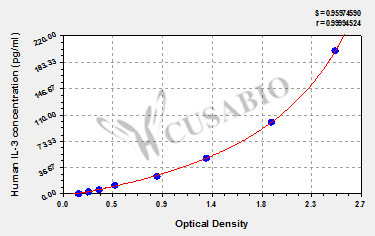
| pg/ml |
OD1 |
OD2 |
Average |
Corrected |
|
|
| 200 |
2.550 |
2.467 |
2.509 |
2.355 |
|
|
| 100 |
1.953 |
1.889 |
1.921 |
1.767 |
|
|
| 50 |
1.305 |
1.343 |
1.324 |
1.170 |
|
|
| 25 |
0.876 |
0.871 |
0.874 |
0.720 |
|
|
| 12.5 |
0.494 |
0.483 |
0.489 |
0.335 |
|
|
| 6.25 |
0.345 |
0.339 |
0.342 |
0.188 |
|
|
| 3.12 |
0.248 |
0.242 |
0.245 |
0.091 |
|
|
| 0 |
0.152 |
0.156 |
0.154 |
|
|
|
|
|
| Storage |
Store at 2-8°C. Please refer to protocol. |
| Lead Time |
3-5 working days |

