Human Liver Type Fatty Acid Binding Protein(L-FABP) ELISA KIT
Product Details
| Target Name |
fatty acid binding protein 1, liver |
| Alternative Names |
FABP 1 ELISA Kit; FABP1 ELISA Kit; FABPL ELISA Kit; FABPL_HUMAN ELISA Kit; Fatty Acid Binding Protein 1 ELISA Kit; Fatty acid binding protein 1 liver ELISA Kit; Fatty Acid Binding Protein ELISA Kit; Fatty acid-binding protein 1 ELISA Kit; Fatty acid-binding protein ELISA Kit; Fatty acid-binding protein liver ELISA Kit; L FABP ELISA Kit; L-FABP ELISA Kit; liver ELISA Kit; Liver-type fatty acid-binding protein ELISA Kit |
| Abbreviation |
FABP1 |
| Species |
Homo sapiens (Human) |
| Sample Types |
serum, plasma, cell culture supernates |
| Detection Range |
31.2 pg/mL-2000pg/mL |
| Sensitivity |
7.8 pg/mL |
| Assay Time |
1-5h |
| Sample Volume |
50-100ul |
| Detection Wavelength |
450 nm |
| Research Area |
Signal Transduction |
| Assay Principle |
quantitative |
| Measurement |
Sandwich |
| Precision |
| Intra-assay Precision (Precision within an assay): CV% |
| Three samples of known concentration were tested twenty times on one plate to assess. |
|
| Inter-assay Precision (Precision between assays): CV% |
| Three samples of known concentration were tested in twenty assays to assess. |
|
|
| |
|
|
|
|
|
|
|
| Linearity |
| To assess the linearity of the assay, samples were spiked with high concentrations of human L-FABP in various matrices and diluted with the Sample Diluent to produce samples with values within the dynamic range of the assay. |
| |
Sample |
Serum(n=4) |
|
| 1:100 |
Average % |
86 |
|
| Range % |
80-92 |
|
| 1:200 |
Average % |
98 |
|
| Range % |
91-105 |
|
| 1:400 |
Average % |
98 |
|
| Range % |
92-110 |
|
| 1:800 |
Average % |
94 |
|
| Range % |
86-98 |
|
|
| Recovery |
| The recovery of human L-FABP spiked to levels throughout the range of the assay in various matrices was evaluated. Samples were diluted prior to assay as directed in the Sample Preparation section. |
| Sample Type |
Average % Recovery |
Range |
|
| Serum (n=5) |
95 |
89-98 |
|
| EDTA plasma (n=4) |
96 |
90-100 |
|
| |
|
|
|
|
|
|
| |
|
|
|
|
|
|
|
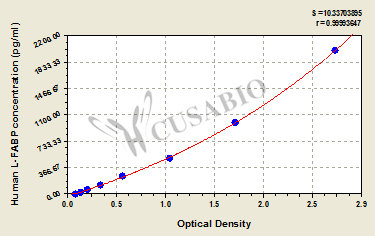
| Typical Data |
| These standard curves are provided for demonstration only. A standard curve should be generated for each set of samples assayed. |
| pg/ml |
OD1 |
OD2 |
Average |
Corrected |
|
| 2000 |
2.716 |
2.652 |
2.684 |
2.604 |
|
| 1000 |
1.690 |
1.676 |
1.683 |
1.603 |
|
| 500 |
1.049 |
1.002 |
1.026 |
0.946 |
|
| 250 |
0.566 |
0.539 |
0.553 |
0.473 |
|
| 125 |
0.342 |
0.324 |
0.333 |
0.253 |
|
| 62.5 |
0.208 |
0.199 |
0.204 |
0.124 |
|
| 31.25 |
0.148 |
0.138 |
0.143 |
0.063 |
|
| 0 |
0.083 |
0.077 |
0.080 |
|
|
|
|
| Storage |
Store at 2-8°C. Please refer to protocol. |
| Lead Time |
3-5 working days |