Human milk fat globule-EGF factor 8 protein(MFGE8) ELISA kit
Product Details
| Target Name |
milk fat globule-EGF factor 8 protein |
| Alternative Names |
BA46 ELISA Kit; Breast epithelial antigen BA46 ELISA Kit; EDIL1 ELISA Kit; HMFG ELISA Kit; hP47 ELISA Kit; HsT19888 ELISA Kit; Lactadherin ELISA Kit; Medin ELISA Kit; MFG-E8 ELISA Kit; MFGE8 ELISA Kit; MFGM ELISA Kit; MFGM_HUMAN ELISA Kit; Milk fat globule EGF factor 8 ELISA Kit; Milk fat globule EGF factor 8 protein ELISA Kit; Milk fat globule-EGF factor 8 ELISA Kit; O acetyl disialoganglioside synthase ELISA Kit; OAcGD3S ELISA Kit; SED1 ELISA Kit; SPAG10 ELISA Kit; Sperm associated antigen 10 ELISA Kit; Sperm surface protein hP47 ELISA Kit |
| Abbreviation |
MFGE8 |
| Species |
Homo sapiens (Human) |
| Sample Types |
serum, cell culture supernates, urine, cerebrospinal fluid (CSF) |
| Detection Range |
781.25 pg/mL-50000 pg/mL |
| Sensitivity |
195.31 pg/mL |
| Assay Time |
1-5h |
| Sample Volume |
50-100ul |
| Detection Wavelength |
450 nm |
| Research Area |
Cardiovascular |
| Assay Principle |
quantitative |
| Measurement |
Sandwich |
| Precision |
| Intra-assay Precision (Precision within an assay): CV% |
| Three samples of known concentration were tested twenty times on one plate to assess. |
|
| Inter-assay Precision (Precision between assays): CV% |
| Three samples of known concentration were tested in twenty assays to assess. |
|
|
| |
|
|
|
|
|
|
|
| Linearity |
| To assess the linearity of the assay, samples were spiked with high concentrations of human MFGE8 in various matrices and diluted with the Sample Diluent to produce samples with values within the dynamic range of the assay. |
| |
Sample |
Serum(n=4) |
|
| 1:1 |
Average % |
93 |
|
| Range % |
85-100 |
|
| 1:2 |
Average % |
97 |
|
| Range % |
92-105 |
|
| 1:4 |
Average % |
91 |
|
| Range % |
85-96 |
|
| 1:8 |
Average % |
85 |
|
| Range % |
80-93 |
|
|
| Recovery |
| The recovery of human MFGE8 spiked to levels throughout the range of the assay in various matrices was evaluated. Samples were diluted prior to assay as directed in the Sample Preparation section. |
| Sample Type |
Average % Recovery |
Range |
|
| Serum (n=5) |
95 |
85-99 |
|
| |
|
|
|
|
|
|
| |
|
|
|
|
|
|
|
| Typical Data |
| These standard curves are provided for demonstration only. A standard curve should be generated for each set of samples assayed. |
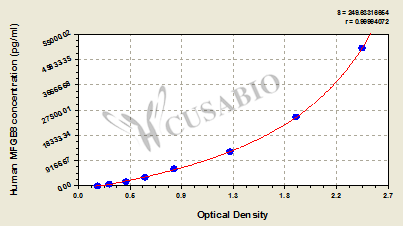
| pg/ml |
OD1 |
OD2 |
Average |
Corrected |
|
| 50000 |
2.437 |
2.452 |
2.445 |
2.264 |
|
| 25000 |
1.885 |
1.876 |
1.881 |
1.700 |
|
| 12500 |
1.304 |
1.324 |
1.314 |
1.133 |
|
| 6250 |
0.821 |
0.854 |
0.838 |
0.657 |
|
| 3125 |
0.595 |
0.584 |
0.590 |
0.409 |
|
| 1562.5 |
0.414 |
0.436 |
0.425 |
0.244 |
|
| 781.25 |
0.289 |
0.279 |
0.284 |
0.103 |
|
| 0 |
0.174 |
0.187 |
0.181 |
|
|
|
|
| Storage |
Store at 2-8°C. Please refer to protocol. |
| Lead Time |
3-5 working days |