Human Polycomb complex protein BMI-1(BMI1) ELISA kit
Product Details
| Target Name |
BMI1 polycomb ring finger oncogene |
| Alternative Names |
B lymphoma Mo MLV insertion region (mouse) ELISA Kit; B lymphoma Mo MLV insertion region 1 homolog ELISA Kit; Bmi 1 ELISA Kit; BMI1 ELISA Kit; BMI1 polycomb ring finger oncogene ELISA Kit; BMI1_HUMAN ELISA Kit; Flvi 2/bmi 1 ELISA Kit; FLVI2/BMI1 ELISA Kit; MGC12685 ELISA Kit; Murine leukemia viral (bmi 1) oncogene homolog ELISA Kit; Oncogene BMI 1 ELISA Kit; PCGF 4 ELISA Kit; PCGF4 ELISA Kit; Polycomb complex protein BMI 1 ELISA Kit; Polycomb complex protein BMI-1 ELISA Kit; Polycomb group protein Bmi1 ELISA Kit; Polycomb group ring finger 4 ELISA Kit; Polycomb group RING finger protein 4 ELISA Kit; RING finger protein 51 ELISA Kit; RNF 51 ELISA Kit; RNF51 ELISA Kit |
| Abbreviation |
BMI1 |
| Species |
Homo sapiens (Human) |
| Sample Types |
serum, plasma, tissue homogenates, cell lysates |
| Detection Range |
25 pg/mL-1600 pg/mL |
| Sensitivity |
6.25 pg/mL |
| Assay Time |
1-5h |
| Sample Volume |
50-100ul |
| Detection Wavelength |
450 nm |
| Research Area |
Cancer |
| Assay Principle |
quantitative |
| Measurement |
Sandwich |
| Precision |
| Intra-assay Precision (Precision within an assay): CV% |
|
|
|
|
| Three samples of known concentration were tested twenty times on one plate to assess. |
|
|
| Inter-assay Precision (Precision between assays): CV% |
|
|
|
|
| Three samples of known concentration were tested in twenty assays to assess. |
|
|
|
| |
|
|
|
|
|
|
|
|
| Linearity |
| To assess the linearity of the assay, samples were spiked with high concentrations of human BMI1 in various matrices and diluted with the Sample Diluent to produce samples with values within the dynamic range of the assay. |
|
| |
Sample |
Serum(n=4) |
|
|
| 1:1 |
Average % |
89 |
|
|
| Range % |
84-93 |
|
|
| 1:2 |
Average % |
95 |
|
|
| Range % |
90-100 |
|
|
| 1:4 |
Average % |
103 |
|
|
| Range % |
99-107 |
|
|
| 1:8 |
Average % |
90 |
|
|
| Range % |
85-95 |
|
|
|
| Recovery |
| The recovery of human BMI1 spiked to levels throughout the range of the assay in various matrices was evaluated. Samples were diluted prior to assay as directed in the Sample Preparation section. |
|
| |
| Sample Type |
Average % Recovery |
Range |
|
|
| Serum (n=5) |
85 |
80-89 |
|
|
| EDTA plasma (n=4) |
94 |
90-98 |
|
|
| |
|
|
|
|
|
|
|
| |
|
|
|
|
|
|
|
|
| Typical Data |
| These standard curves are provided for demonstration only. A standard curve should be generated for each set of samples assayed. |
|
| |
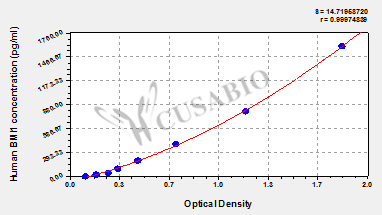
| pg/ml |
OD1 |
OD2 |
Average |
Corrected |
|
|
| 1600 |
1.768 |
1.896 |
1.832 |
1.714 |
|
|
| 800 |
1.169 |
1.203 |
1.186 |
1.068 |
|
|
| 400 |
0.739 |
0.704 |
0.722 |
0.604 |
|
|
| 200 |
0.472 |
0.457 |
0.465 |
0.347 |
|
|
| 100 |
0.320 |
0.340 |
0.330 |
0.212 |
|
|
| 50 |
0.267 |
0.271 |
0.269 |
0.151 |
|
|
| 25 |
0.195 |
0.182 |
0.189 |
0.071 |
|
|
| 0 |
0.121 |
0.115 |
0.118 |
|
|
|
|
|
| Storage |
Store at 2-8°C. Please refer to protocol. |
| Lead Time |
5-7 working days |