Human Pulmonary surfactant-associated protein B,SP-B ELISA Kit
Product Details
| Target Name |
surfactant protein B |
| Alternative Names |
18 kDa pulmonary-surfactant protein ELISA Kit; 6 kDa protein ELISA Kit; PSP B ELISA Kit; PSPB ELISA Kit; PSPB_HUMAN ELISA Kit; Pulmonary surfactant apoprotein PSP-B ELISA Kit; Pulmonary surfactant-associated protein B ELISA Kit; Pulmonary surfactant-associated protein, 18-KD ELISA Kit; Pulmonary surfactant-associated proteolipid SPL(Phe) ELISA Kit; SFTB3 ELISA Kit; SFTP3 ELISA Kit; SFTPB ELISA Kit; SMDP1 ELISA Kit; SP B ELISA Kit; SP-B ELISA Kit; SPB ELISA Kit; surfactant protein B ELISA Kit; Surfactant, pulmonary-associated protein B ELISA Kit; surfactant-associated protein, pulmonary, 3 ELISA Kit |
| Abbreviation |
SFTPB |
| Species |
Homo sapiens (Human) |
| Sample Types |
serum, plasma, urine, cell culture supernates |
| Detection Range |
0.156 ng/mL-10 ng/mL |
| Sensitivity |
0.039 ng/mL |
| Assay Time |
1-5h |
| Sample Volume |
50-100ul |
| Detection Wavelength |
450 nm |
| Research Area |
Signal Transduction |
| Assay Principle |
quantitative |
| Measurement |
Sandwich |
| Precision |
| Intra-assay Precision (Precision within an assay): CV% |
| Three samples of known concentration were tested twenty times on one plate to assess. |
|
| Inter-assay Precision (Precision between assays): CV% |
| Three samples of known concentration were tested in twenty assays to assess. |
|
|
| |
|
|
|
|
|
|
|
| Linearity |
| To assess the linearity of the assay, samples were spiked with high concentrations of human SP-B in various matrices and diluted with the Sample Diluent to produce samples with values within the dynamic range of the assay. |
| |
Sample |
Serum(n=4) |
|
| 1:100 |
Average % |
89 |
|
| Range % |
83-95 |
|
| 1:200 |
Average % |
93 |
|
| Range % |
87-100 |
|
| 1:400 |
Average % |
88 |
|
| Range % |
85-91 |
|
| 1:800 |
Average % |
93 |
|
| Range % |
86-98 |
|
|
| Recovery |
| The recovery of human SP-B spiked to levels throughout the range of the assay in various matrices was evaluated. Samples were diluted prior to assay as directed in the Sample Preparation section. |
| Sample Type |
Average % Recovery |
Range |
|
| Serum (n=5) |
94 |
90-99 |
|
| EDTA plasma (n=4) |
96 |
89-100 |
|
| |
|
|
|
|
|
|
| |
|
|
|
|
|
|
|
| Typical Data |
| These standard curves are provided for demonstration only. A standard curve should be generated for each set of samples assayed. |
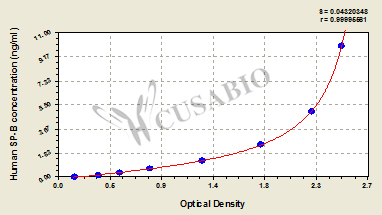
| ng/ml |
OD1 |
OD2 |
Average |
Corrected |
|
| 10 |
2.453 |
2.563 |
2.508 |
2.347 |
|
| 5 |
2.228 |
2.261 |
2.245 |
2.084 |
|
| 2.5 |
1.795 |
1.801 |
1.798 |
1.637 |
|
| 1.25 |
1.267 |
1.297 |
1.282 |
1.121 |
|
| 0.625 |
0.811 |
0.834 |
0.823 |
0.662 |
|
| 0.312 |
0.532 |
0.575 |
0.554 |
0.393 |
|
| 0.156 |
0.362 |
0.371 |
0.367 |
0.206 |
|
| 0 |
0.160 |
0.162 |
0.161 |
|
|
|
|
| Storage |
Store at 2-8°C. Please refer to protocol. |
| Lead Time |
3-5 working days |