Human Retinol binding protein 4,RBP-4 ELISA Kit
Product Details
| Target Name |
retinol binding protein 4, plasma |
| Alternative Names |
OTTHUMP00000020114 ELISA Kit; OTTHUMP00000020115 ELISA Kit; OTTHUMP00000020116 ELISA Kit; Plasma retinol binding protein 4 ELISA Kit; Plasma retinol-binding protein ELISA Kit; Plasma retinol-binding protein(1-176) ELISA Kit; PRBP ELISA Kit; PRO2222 ELISA Kit; RBP ELISA Kit; RBP4 ELISA Kit; RDCCAS ELISA Kit; RET4_HUMAN ELISA Kit; Retinol binding protein 4 ELISA Kit; Retinol binding protein 4 interstitial ELISA Kit; Retinol binding protein 4 plasma ELISA Kit |
| Abbreviation |
RBP4 |
| Species |
Homo sapiens (Human) |
| Sample Types |
serum, plasma, tissue homogenates |
| Detection Range |
15.6 ng/mL-1000 ng/mL |
| Sensitivity |
3.9 ng/mL |
| Assay Time |
1-5h |
| Sample Volume |
50-100ul |
| Detection Wavelength |
450 nm |
| Research Area |
Signal Transduction |
| Assay Principle |
quantitative |
| Measurement |
Sandwich |
| Precision |
| Intra-assay Precision (Precision within an assay): CV% |
| Three samples of known concentration were tested twenty times on one plate to assess. |
|
| Inter-assay Precision (Precision between assays): CV% |
| Three samples of known concentration were tested in twenty assays to assess. |
|
|
| |
|
|
|
|
|
|
|
| Linearity |
| To assess the linearity of the assay, samples were spiked with high concentrations of human RBP-4 in various matrices and diluted with the Sample Diluent to produce samples with values within the dynamic range of the assay. |
| |
Sample |
Serum(n=4) |
|
| 1:100 |
Average % |
92 |
|
| Range % |
87-98 |
|
| 1:200 |
Average % |
98 |
|
| Range % |
93-104 |
|
| 1:400 |
Average % |
84 |
|
| Range % |
82-88 |
|
| 1:800 |
Average % |
90 |
|
| Range % |
85-97 |
|
|
| Recovery |
| The recovery of human RBP-4 spiked to levels throughout the range of the assay in various matrices was evaluated. Samples were diluted prior to assay as directed in the Sample Preparation section. |
| Sample Type |
Average % Recovery |
Range |
|
| Serum (n=5) |
95 |
89-99 |
|
| EDTA plasma (n=4) |
96 |
90-102 |
|
| |
|
|
|
|
|
|
| |
|
|
|
|
|
|
|
| Typical Data |
| These standard curves are provided for demonstration only. A standard curve should be generated for each set of samples assayed. |
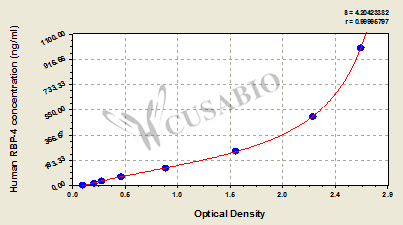
| ng/ml |
OD1 |
OD2 |
Average |
Corrected |
|
| 1000 |
2.634 |
2.702 |
2.668 |
2.566 |
|
| 500 |
2.234 |
2.217 |
2.226 |
2.124 |
|
| 250 |
1.496 |
1.527 |
1.512 |
1.410 |
|
| 125 |
0.856 |
0.879 |
0.868 |
0.766 |
|
| 62.5 |
0.446 |
0.468 |
0.457 |
0.355 |
|
| 31.2 |
0.267 |
0.285 |
0.276 |
0.174 |
|
| 15.6 |
0.206 |
0.212 |
0.209 |
0.107 |
|
| 0 |
0.105 |
0.099 |
0.102 |
|
|
|
|
| Storage |
Store at 2-8°C. Please refer to protocol. |
| Lead Time |
3-5 working days |