Human Soluble protein-100,S-100 ELISA Kit
Product Details
| Target Name |
S100 calcium binding protein A1 |
| Alternative Names |
Bpb ELISA Kit; NEF ELISA Kit; Protein S100-A1 ELISA Kit; S-100 protein alpha chain ELISA Kit; S-100 protein subunit alpha ELISA Kit; S100 alpha ELISA Kit; S100 beta ELISA Kit; S100 calcium binding protein A1 ELISA Kit; S100 calcium binding protein B ELISA Kit; S100 calcium-binding protein A1 ELISA Kit; S100 protein alpha polypeptide ELISA Kit; S100A ELISA Kit; s100a1 ELISA Kit; S100B ELISA Kit; S100beta ELISA Kit; S10A1_HUMAN ELISA Kit |
| Abbreviation |
S100A1 |
| Species |
Homo sapiens (Human) |
| Sample Types |
serum, plasma, tissue homogenates |
| Detection Range |
0.156 ng/mL-10 ng/mL |
| Sensitivity |
0.039 ng/mL |
| Assay Time |
1-5h |
| Sample Volume |
50-100ul |
| Detection Wavelength |
450 nm |
| Research Area |
Signal Transduction |
| Assay Principle |
quantitative |
| Measurement |
Sandwich |
| Precision |
| Intra-assay Precision (Precision within an assay): CV% |
| Three samples of known concentration were tested twenty times on one plate to assess. |
|
| Inter-assay Precision (Precision between assays): CV% |
| Three samples of known concentration were tested in twenty assays to assess. |
|
|
| |
|
|
|
|
|
|
|
| Linearity |
| To assess the linearity of the assay, samples were spiked with high concentrations of human S-100 in various matrices and diluted with the Sample Diluent to produce samples with values within the dynamic range of the assay. |
| |
Sample |
Serum(n=4) |
|
| 1:1 |
Average % |
93 |
|
| Range % |
90-96 |
|
| 1:2 |
Average % |
102 |
|
| Range % |
97-107 |
|
| 1:4 |
Average % |
87 |
|
| Range % |
82-90 |
|
| 1:8 |
Average % |
100 |
|
| Range % |
97-103 |
|
|
| Recovery |
| The recovery of human S-100 spiked to levels throughout the range of the assay in various matrices was evaluated. Samples were diluted prior to assay as directed in the Sample Preparation section. |
| Sample Type |
Average % Recovery |
Range |
|
| Serum (n=5) |
95 |
89-98 |
|
| EDTA plasma (n=4) |
97 |
90-100 |
|
| |
|
|
|
|
|
|
| |
|
|
|
|
|
|
|
| Typical Data |
| These standard curves are provided for demonstration only. A standard curve should be generated for each set of samples assayed. |
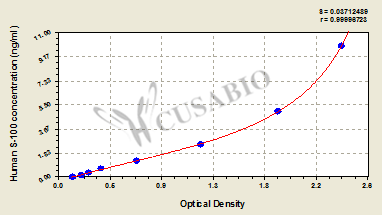
| ng/ml |
OD1 |
OD2 |
Average |
Corrected |
|
| 10 |
2.401 |
2.438 |
2.420 |
2.284 |
|
| 5 |
1.892 |
1.871 |
1.882 |
1.746 |
|
| 2.5 |
1.212 |
1.234 |
1.223 |
1.087 |
|
| 1.25 |
0.661 |
0.698 |
0.680 |
0.544 |
|
| 0.625 |
0.364 |
0.384 |
0.374 |
0.238 |
|
| 0.312 |
0.283 |
0.261 |
0.272 |
0.136 |
|
| 0.156 |
0.206 |
0.213 |
0.210 |
0.074 |
|
| 0 |
0.135 |
0.137 |
0.136 |
|
|
|
|
| Storage |
Store at 2-8°C. Please refer to protocol. |
| Lead Time |
3-5 working days |