Human TGF-beta-inducible early response gene-1,TIEG1 ELISA Kit
Product Details
| Target Name |
Kruppel-like factor 10 |
| Alternative Names |
Early growth response; alpha ELISA Kit; Early growth response; alpha like ELISA Kit; EGR A ELISA Kit; EGR alpha ELISA Kit; EGR(A) ELISA Kit; EGR-alpha ELISA Kit; EGRA ELISA Kit; Egral ELISA Kit; EGRalpha ELISA Kit; Gdnfif ELISA Kit; KLF 10 ELISA Kit; KLF10 ELISA Kit; KLF10_HUMAN ELISA Kit; Krueppel like factor 10 ELISA Kit; Krueppel like factor10 ELISA Kit; Krueppel-like factor 10 ELISA Kit; Kruppel like factor 10 ELISA Kit; mGIF ELISA Kit; TGF-beta- inducible early gene ELISA Kit; TGFB inducible early growth response 1 ELISA Kit; TGFB inducible early growth response ELISA Kit; TGFB inducible early growth response protein 1 ELISA Kit; TGFB-inducible early growth response protein 1 ELISA Kit; TIEG 1 ELISA Kit; TIEG ELISA Kit; TIEG-1 ELISA Kit; TIEG1 ELISA Kit; Transforming growth factor beta inducible early growth response ELISA Kit; Transforming growth factor beta inducible early growth response protein 1 ELISA Kit; Transforming growth factor-beta-inducible early growth response protein 1 ELISA Kit; Zinc finger transcription factor TIEG ELISA Kit |
| Abbreviation |
KLF10 |
| Species |
Homo sapiens (Human) |
| Sample Types |
serum, plasma, tissue homogenates, cell lysates |
| Detection Range |
34.38 pg/mL-2200 pg/mL |
| Sensitivity |
8.6 pg/mL |
| Assay Time |
1-5h |
| Sample Volume |
50-100ul |
| Detection Wavelength |
450 nm |
| Research Area |
Cancer |
| Assay Principle |
quantitative |
| Measurement |
Sandwich |
| Precision |
| Intra-assay Precision (Precision within an assay): CV% |
|
|
|
|
| Three samples of known concentration were tested twenty times on one plate to assess. |
|
|
| Inter-assay Precision (Precision between assays): CV% |
|
|
|
|
| Three samples of known concentration were tested in twenty assays to assess. |
|
|
|
| |
|
|
|
|
|
|
|
|
| Linearity |
| To assess the linearity of the assay, samples were spiked with high concentrations of human TIEG1 in various matrices and diluted with the Sample Diluent to produce samples with values within the dynamic range of the assay. |
|
| |
Sample |
Serum(n=4) |
|
|
| 1:1 |
Average % |
85 |
|
|
| Range % |
81-89 |
|
|
| 1:2 |
Average % |
93 |
|
|
| Range % |
90-96 |
|
|
| 1:4 |
Average % |
84 |
|
|
| Range % |
81-86 |
|
|
| 1:8 |
Average % |
95 |
|
|
| Range % |
91-99 |
|
|
|
| Recovery |
| The recovery of human TIEG1 spiked to levels throughout the range of the assay in various matrices was evaluated. Samples were diluted prior to assay as directed in the Sample Preparation section. |
|
| |
| Sample Type |
Average % Recovery |
Range |
|
|
| Serum (n=5) |
103 |
100-105 |
|
|
| EDTA plasma (n=4) |
98 |
94-102 |
|
|
| |
|
|
|
|
|
|
|
| |
|
|
|
|
|
|
|
|
| Typical Data |
| These standard curves are provided for demonstration only. A standard curve should be generated for each set of samples assayed. |
|
| |
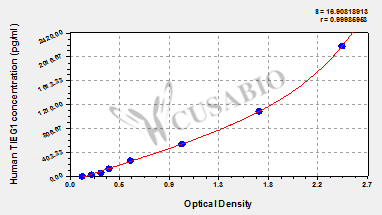
| pg/ml |
OD1 |
OD2 |
Average |
Corrected |
|
|
| 2200 |
2.435 |
2.431 |
2.433 |
2.310 |
|
|
| 1100 |
1.708 |
1.687 |
1.698 |
1.575 |
|
|
| 550 |
1.020 |
1.000 |
1.010 |
0.887 |
|
|
| 275 |
0.533 |
0.570 |
0.552 |
0.429 |
|
|
| 137.5 |
0.361 |
0.358 |
0.360 |
0.237 |
|
|
| 68.75 |
0.291 |
0.287 |
0.289 |
0.166 |
|
|
| 34.38 |
0.203 |
0.212 |
0.208 |
0.085 |
|
|
| 0 |
0.122 |
0.124 |
0.123 |
|
|
|
|
|
| Storage |
Store at 2-8°C. Please refer to protocol. |
| Lead Time |
3-5 working days |