Human thymus activation regulated chemokine,TARC ELISA Kit
Product Details
| Target Name |
chemokine (C-C motif) ligand 17 |
| Alternative Names |
A-152E5.3 ELISA Kit; A152E53 ELISA Kit; ABCD 2 ELISA Kit; ABCD2 ELISA Kit; C-C motif chemokine 17 ELISA Kit; CC chemokine TARC ELISA Kit; CCL17 ELISA Kit; CCL17_HUMAN ELISA Kit; Chemokine CC Motif Ligand 17 ELISA Kit; MGC138271 ELISA Kit; MGC138273 ELISA Kit; SCYA17 ELISA Kit; Small Inducible Cytokine A17 ELISA Kit; Small Inducible Cytokine A17 Precursor ELISA Kit; Small Inducible Cytokine Subfamily A (Cys Cys) ELISA Kit; Small Inducible Cytokine Subfamily A (Cys Cys) Member 17 ELISA Kit; Small-inducible cytokine A17 ELISA Kit; T Cell Directed CC Chemokine ELISA Kit; Thymus and activation regulated chemokine ELISA Kit; Thymus and activation-regulated chemokine ELISA Kit |
| Abbreviation |
CCL17 |
| Species |
Homo sapiens (Human) |
| Sample Types |
serum, plasma, tissue homogenates |
| Detection Range |
15.6 pg/mL-1000 pg/mL |
| Sensitivity |
3.9 pg/mL |
| Assay Time |
1-5h |
| Sample Volume |
50-100ul |
| Detection Wavelength |
450 nm |
| Research Area |
Immunology |
| Assay Principle |
quantitative |
| Measurement |
Sandwich |
| Precision |
| Intra-assay Precision (Precision within an assay): CV%<8> |
|
|
|
|
| Three samples of known concentration were tested twenty times on one plate to assess. |
|
|
| Inter-assay Precision (Precision between assays): CV%<10> |
|
|
|
|
| Three samples of known concentration were tested in twenty assays to assess. |
|
|
|
| |
|
|
|
|
|
|
|
|
| Linearity |
| To assess the linearity of the assay, samples were spiked with high concentrations of human TARC in various matrices and diluted with the Sample Diluent to produce samples with values within the dynamic range of the assay. |
|
| |
Sample |
Serum(n=4) |
|
|
| 1:5 |
Average % |
106 |
|
|
| Range % |
101-115 |
|
|
| 1:10 |
Average % |
104 |
|
|
| Range % |
102-108 |
|
|
| 1:20 |
Average % |
87 |
|
|
| Range % |
84-93 |
|
|
| 1:40 |
Average % |
94 |
|
|
| Range % |
90-97 |
|
|
|
| Recovery |
| The recovery of human TARC spiked to levels throughout the range of the assay in various matrices was evaluated. Samples were diluted prior to assay as directed in the Sample Preparation section. |
|
| |
| Sample Type |
Average % Recovery |
Range |
|
|
| Serum (n=5) |
96 |
90-101 |
|
|
| EDTA plasma (n=4) |
89 |
85-92 |
|
|
| |
|
|
|
|
|
|
|
| |
|
|
|
|
|
|
|
|
| Typical Data |
| These standard curves are provided for demonstration only. A standard curve should be generated for each set of samples assayed. |
|
| |
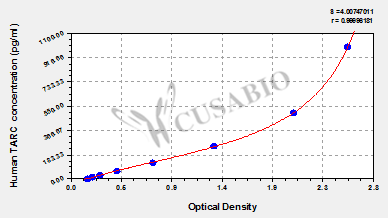
| pg/ml |
OD1 |
OD2 |
Average |
Corrected |
|
|
| 1000 |
2.455 |
2.655 |
2.555 |
2.385 |
|
|
| 500 |
2.015 |
2.101 |
2.058 |
1.888 |
|
|
| 250 |
1.323 |
1.333 |
1.328 |
1.158 |
|
|
| 125 |
0.738 |
0.802 |
0.770 |
0.600 |
|
|
| 62.5 |
0.420 |
0.453 |
0.437 |
0.267 |
|
|
| 31.2 |
0.288 |
0.282 |
0.285 |
0.115 |
|
|
| 15.6 |
0.213 |
0.218 |
0.216 |
0.046 |
|
|
| 0 |
0.169 |
0.171 |
0.170 |
|
|
|
|
|
| Storage |
Store at 2-8°C. Please refer to protocol. |
| Lead Time |
3-5 working da |