Human transferrin(TF) ELISA Kit
Product Details
| Target Name |
transferrin |
| Alternative Names |
Apotransferrin ELISA Kit; Beta 1 metal binding globulin ELISA Kit; Beta-1 metal-binding globulin ELISA Kit; DKFZp781D0156 ELISA Kit; PRO1400 ELISA Kit; PRO1557 ELISA Kit; PRO2086 ELISA Kit; Serotransferrin ELISA Kit; Serotransferrin precursor ELISA Kit; Siderophilin ELISA Kit; TF ELISA Kit; TFQTL1 ELISA Kit; Transferin ELISA Kit; Transferrin ELISA Kit; TRFE_HUMAN ELISA Kit |
| Abbreviation |
TF |
| Species |
Homo sapiens (Human) |
| Sample Types |
serum, plasma, urine, cell culture supernates, cerebrospinal fluid (CSF) |
| Detection Range |
0.023 nmol/L-1.5 nmol/L |
| Sensitivity |
0.006 nmol/L |
| Assay Time |
1-5h |
| Sample Volume |
50-100ul |
| Detection Wavelength |
450 nm |
| Research Area |
Cardiovascular |
| Assay Principle |
quantitative |
| Measurement |
Sandwich |
| Precision |
| Intra-assay Precision (Precision within an assay): CV% |
| Three samples of known concentration were tested twenty times on one plate to assess. |
|
| Inter-assay Precision (Precision between assays): CV% |
| Three samples of known concentration were tested in twenty assays to assess. |
|
|
| |
|
|
|
|
|
|
|
| Linearity |
| To assess the linearity of the assay, samples were spiked with high concentrations of human TF in various matrices and diluted with the Sample Diluent to produce samples with values within the dynamic range of the assay. |
| |
Sample |
Serum(n=4) |
|
| 1:50000 |
Average % |
89 |
|
| Range % |
84-95 |
|
| 1:100000 |
Average % |
92 |
|
| Range % |
87-97 |
|
| 1:200000 |
Average % |
96 |
|
| Range % |
90-101 |
|
| 1:400000 |
Average % |
90 |
|
| Range % |
86-96 |
|
|
| Recovery |
| The recovery of human TF spiked to levels throughout the range of the assay in various matrices was evaluated. Samples were diluted prior to assay as directed in the Sample Preparation section. |
| Sample Type |
Average % Recovery |
Range |
|
| Serum (n=5) |
96 |
89-101 |
|
| EDTA plasma (n=4) |
98 |
93-105 |
|
| |
|
|
|
|
|
|
| |
|
|
|
|
|
|
|
| Typical Data |
| These standard curves are provided for demonstration only. A standard curve should be generated for each set of samples assayed. |
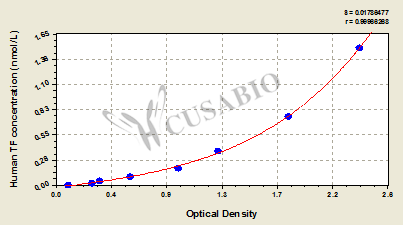
| nmol/L |
OD1 |
OD2 |
Average |
Corrected |
|
| 1.5 |
2.367 |
2.396 |
2.382 |
2.278 |
|
| 0.75 |
1.898 |
1.753 |
1.826 |
1.722 |
|
| 0.375 |
1.262 |
1.288 |
1.275 |
1.171 |
|
| 0.187 |
0.948 |
0.982 |
0.965 |
0.861 |
|
| 0.094 |
0.583 |
0.597 |
0.590 |
0.486 |
|
| 0.047 |
0.353 |
0.348 |
0.351 |
0.247 |
|
| 0.023 |
0.284 |
0.295 |
0.290 |
0.186 |
|
| 0 |
0.102 |
0.106 |
0.104 |
|
|
|
|
| Storage |
Store at 2-8°C. Please refer to protocol. |
| Lead Time |
3-5 working days |