Human transthyretin(TTR) ELISA kit
Product Details
| Target Name |
transthyretin |
| Alternative Names |
Amyloid polyneuropathy ELISA Kit; Amyloidosis I ELISA Kit; ATTR ELISA Kit; Carpal tunnel syndrome 1 ELISA Kit; CTS ELISA Kit; CTS1 ELISA Kit; Dysprealbuminemic euthyroidal hyperthyroxinemia ELISA Kit; Dystransthyretinemic hyperthyroxinemia ELISA Kit; Epididymis luminal protein 111 ELISA Kit; HEL111 ELISA Kit; HsT2651 ELISA Kit; PALB ELISA Kit; Prealbumin amyloidosis type I ELISA Kit; Prealbumin ELISA Kit; Prealbumin Thyroxine-binding ELISA Kit; Senile systemic amyloidosis ELISA Kit; TBPA ELISA Kit; Thyroxine binding prealbumin ELISA Kit; Transthyretin ELISA Kit; TTHY_HUMAN ELISA Kit; TTR ELISA Kit; TTR protein ELISA Kit |
| Abbreviation |
TTR |
| Species |
Homo sapiens (Human) |
| Sample Types |
serum, plasma, tissue homogenates |
| Detection Range |
1.56 μg/mL-25 μg/mL |
| Sensitivity |
0.78 μg/mL |
| Assay Time |
1-5h |
| Sample Volume |
50-100ul |
| Detection Wavelength |
450 nm |
| Research Area |
Cardiovascular |
| Assay Principle |
quantitative |
| Measurement |
Competitive |
| Precision |
| Intra-assay Precision (Precision within an assay): CV% |
| Three samples of known concentration were tested twenty times on one plate to assess. |
|
| Inter-assay Precision (Precision between assays): CV% |
| Three samples of known concentration were tested in twenty assays to assess. |
|
|
| |
|
|
|
|
|
|
|
| Linearity |
| To assess the linearity of the assay, samples were spiked with high concentrations of human TTR in various matrices and diluted with the Sample Diluent to produce samples with values within the dynamic range of the assay. |
| |
Sample |
Serum(n=4) |
|
| 1:100 |
Average % |
90 |
|
| Range % |
87-97 |
|
| 1:200 |
Average % |
97 |
|
| Range % |
93-104 |
|
| 1:400 |
Average % |
85 |
|
| Range % |
82-91 |
|
| 1:800 |
Average % |
90 |
|
| Range % |
85-97 |
|
|
| Recovery |
| The recovery of human TTR spiked to levels throughout the range of the assay in various matrices was evaluated. Samples were diluted prior to assay as directed in the Sample Preparation section. |
| Sample Type |
Average % Recovery |
Range |
|
| Serum (n=5) |
89 |
85-93 |
|
| EDTA plasma (n=4) |
92 |
88-94 |
|
| |
|
|
|
|
|
|
| |
|
|
|
|
|
|
|
| Typical Data |
| These standard curves are provided for demonstration only. A standard curve should be generated for each set of samples assayed. |
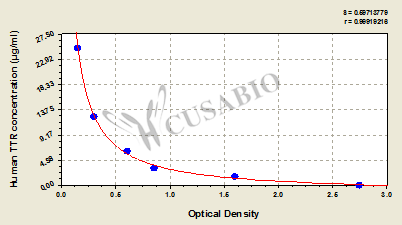
| μg/ml |
OD1 |
OD2 |
Average |
|
|
| 25 |
0.165 |
0.162 |
0.164 |
|
|
| 12.5 |
0.311 |
0.305 |
0.308 |
|
|
| 6.25 |
0.612 |
0.606 |
0.609 |
|
|
| 3.12 |
0.856 |
0.849 |
0.853 |
|
|
| 1.56 |
1.583 |
1.575 |
1.579 |
|
|
| 0 |
2.715 |
2.690 |
2.703 |
|
|
|
|
| Storage |
Store at 2-8°C. Please refer to protocol. |
| Lead Time |
3-5 working days |