Human Triggering Receptor Expresses on Myeloid Cells-1,TREM-1 ELISA Kit
Product Details
| Target Name |
triggering receptor expressed on myeloid cells 1 |
| Alternative Names |
CD354 ELISA Kit; OTTMUSP00000018206 ELISA Kit; TREM 1 ELISA Kit; TREM-1 ELISA Kit; TREM1 ELISA Kit; TREM1_HUMAN ELISA Kit; Triggering receptor expressed on monocytes 1 ELISA Kit; Triggering receptor expressed on myeloid cells 1 ELISA Kit; Triggering receptor TREM 1 ELISA Kit; Triggering receptor TREM1 ELISA Kit |
| Abbreviation |
TREM1 |
| Species |
Homo sapiens (Human) |
| Sample Types |
serum, plasma, tissue homogenates |
| Detection Range |
31.25 pg/mL-2000 pg/mL |
| Sensitivity |
7.81 pg/mL |
| Assay Time |
1-5h |
| Sample Volume |
50-100ul |
| Detection Wavelength |
450 nm |
| Research Area |
Immunology |
| Assay Principle |
quantitative |
| Measurement |
Sandwich |
| Precision |
| Intra-assay Precision (Precision within an assay): CV% |
| Three samples of known concentration were tested twenty times on one plate to assess. |
|
| Inter-assay Precision (Precision between assays): CV% |
| Three samples of known concentration were tested in twenty assays to assess. |
|
|
| |
|
|
|
|
|
|
|
| Linearity |
| To assess the linearity of the assay, samples were spiked with high concentrations of human TREM-1 in various matrices and diluted with the Sample Diluent to produce samples with values within the dynamic range of the assay. |
| |
Sample |
Serum(n=4) |
|
| 1:1 |
Average % |
97 |
|
| Range % |
92-102 |
|
| 1:2 |
Average % |
90 |
|
| Range % |
82-97 |
|
| 1:4 |
Average % |
104 |
|
| Range % |
99-110 |
|
| 1:8 |
Average % |
86 |
|
| Range % |
82-93 |
|
|
| Recovery |
| The recovery of human TREM-1 spiked to levels throughout the range of the assay in various matrices was evaluated. Samples were diluted prior to assay as directed in the Sample Preparation section. |
| Sample Type |
Average % Recovery |
Range |
|
| Serum (n=5) |
90 |
84-96 |
|
| EDTA plasma (n=4) |
96 |
90-101 |
|
| |
|
|
|
|
|
|
| |
|
|
|
|
|
|
|
| Typical Data |
| These standard curves are provided for demonstration only. A standard curve should be generated for each set of samples assayed. |
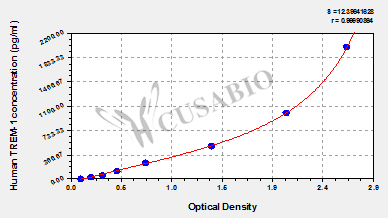
| pg/ml |
OD1 |
OD2 |
Average |
Corrected |
|
| 2000 |
2.529 |
2.752 |
2.641 |
2.538 |
|
| 1000 |
2.038 |
2.079 |
2.059 |
1.956 |
|
| 500 |
1.304 |
1.389 |
1.347 |
1.244 |
|
| 250 |
0.701 |
0.733 |
0.717 |
0.614 |
|
| 125 |
0.441 |
0.455 |
0.448 |
0.345 |
|
| 62.5 |
0.302 |
0.326 |
0.314 |
0.211 |
|
| 31.25 |
0.205 |
0.201 |
0.203 |
0.100 |
|
| 0 |
0.104 |
0.101 |
0.103 |
|
|
|
|
| Storage |
Store at 2-8°C. Please refer to protocol. |
| Lead Time |
3-5 working days |