Human U3 small nucleolar ribonucleoprotein protein IMP3(IMP3) ELISA kit
Product Details
| Target Name |
IMP3, U3 small nucleolar ribonucleoprotein, homolog (yeast) |
| Alternative Names |
BRMS2 ELISA Kit; C15orf12 ELISA Kit; Chromosome 15 open reading frame 12 ELISA Kit; DKFZp586L0118 ELISA Kit; FLJ10968 ELISA Kit; imp3 ELISA Kit; IMP3, U3 small nucleolar ribonucleoprotein, homolog (yeast) ELISA Kit; IMP3_HUMAN ELISA Kit; Mitochondrial ribosomal protein S4 ELISA Kit; MRPS4 ELISA Kit; OTTHUMP00000183524 ELISA Kit; U3 small nucleolar ribonucleoprotein protein imp3 ELISA Kit; U3 snoRNP protein 3 homolog ELISA Kit; U3 snoRNP protein imp3 ELISA Kit |
| Abbreviation |
IMP3 |
| Species |
Homo sapiens (Human) |
| Sample Types |
serum, plasma, tissue homogenates, cell lysates |
| Detection Range |
39 pg/mL-2500 pg/mL |
| Sensitivity |
9.75 pg/mL |
| Assay Time |
1-5h |
| Sample Volume |
50-100ul |
| Detection Wavelength |
450 nm |
| Research Area |
Metabolism |
| Assay Principle |
quantitative |
| Measurement |
Sandwich |
| Precision |
| Intra-assay Precision (Precision within an assay): CV% |
|
|
|
|
| Three samples of known concentration were tested twenty times on one plate to assess. |
|
|
| Inter-assay Precision (Precision between assays): CV% |
|
|
|
|
| Three samples of known concentration were tested in twenty assays to assess. |
|
|
|
| |
|
|
|
|
|
|
|
|
| Linearity |
| To assess the linearity of the assay, samples were spiked with high concentrations of human IMP3 in various matrices and diluted with the Sample Diluent to produce samples with values within the dynamic range of the assay. |
|
| |
Sample |
Serum(n=4) |
|
|
| 1:1 |
Average % |
95 |
|
|
| Range % |
89-99 |
|
|
| 1:2 |
Average % |
97 |
|
|
| Range % |
91-103 |
|
|
| 1:4 |
Average % |
92 |
|
|
| Range % |
87-98 |
|
|
| 1:8 |
Average % |
89 |
|
|
| Range % |
85-93 |
|
|
|
| Recovery |
| The recovery of human IMP3 spiked to levels throughout the range of the assay in various matrices was evaluated. Samples were diluted prior to assay as directed in the Sample Preparation section. |
|
| |
| Sample Type |
Average % Recovery |
Range |
|
|
| Serum (n=5) |
102 |
98-105 |
|
|
| EDTA plasma (n=4) |
86 |
80-91 |
|
|
| |
|
|
|
|
|
|
|
| |
|
|
|
|
|
|
|
|
| Typical Data |
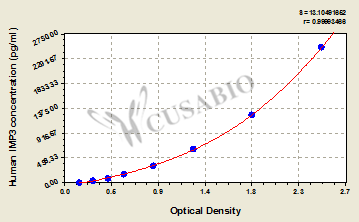 These standard curves are provided for demonstration only. A standard curve should be generated for each set of samples assayed. These standard curves are provided for demonstration only. A standard curve should be generated for each set of samples assayed. |
|
| |
| |
|
|
|
|
|
|
|
| |
|
|
|
|
|
|
|
| |
|
|
|
|
|
|
|
| |
|
|
|
|
|
|
|
| |
|
|
|
|
|
|
|
| |
|
|
|
|
|
|
|
| |
|
|
|
|
|
|
|
| |
|
|
|
|
|
|
|
| |
|
|
|
|
|
|
|
| |
|
|
|
|
|
|
|
| |
|
|
|
|
|
|
|
| |
|
|
|
|
|
|
|
| |
|
|
|
|
|
|
|
| pg/ml |
OD1 |
OD2 |
Average |
Corrected |
|
|
| 2500 |
2.445 |
2.555 |
2.500 |
2.344 |
|
|
| 1250 |
1.791 |
1.861 |
1.826 |
1.670 |
|
|
| 625 |
1.232 |
1.287 |
1.260 |
1.104 |
|
|
| 312 |
0.866 |
0.877 |
0.872 |
0.716 |
|
|
| 156 |
0.580 |
0.593 |
0.587 |
0.431 |
|
|
| 78 |
0.437 |
0.424 |
0.431 |
0.275 |
|
|
| 39 |
0.283 |
0.289 |
0.286 |
0.130 |
|
|
| 0 |
0.155 |
0.156 |
0.156 |
|
|
|
| |
|
|
|
|
|
|
|
|
| Storage |
Store at 2-8°C. Please refer to protocol. |
| Lead Time |
5-7 working days |