Human Vascular Endothelial cell Growth Factor C,VEGF-C ELISA KIT
Product Details
| Target Name |
vascular endothelial growth factor C |
| Alternative Names |
Flt 4L ELISA Kit; Flt4 ligand ELISA Kit; FLT4 ligand DHM ELISA Kit; Flt4-L ELISA Kit; Flt4L ELISA Kit; Vascular endothelial growth factor C ELISA Kit; Vascular endothelial growth factor related protein ELISA Kit; Vascular endothelial growth factor-related protein ELISA Kit; VEGF C ELISA Kit; VEGF-C ELISA Kit; Vegfc ELISA Kit; VEGFC_HUMAN ELISA Kit; VRP ELISA Kit |
| Abbreviation |
VEGFC |
| Species |
Homo sapiens (Human) |
| Sample Types |
serum, plasma, tissue homogenates |
| Detection Range |
15.6 pg/mL-1000 pg/mL |
| Sensitivity |
3.9 pg/mL |
| Assay Time |
1-5h |
| Sample Volume |
50-100ul |
| Detection Wavelength |
450 nm |
| Research Area |
Cancer |
| Assay Principle |
quantitative |
| Measurement |
Sandwich |
| Precision |
| Intra-assay Precision (Precision within an assay): CV% |
| Three samples of known concentration were tested twenty times on one plate to assess. |
|
|
| Inter-assay Precision (Precision between assays): CV% |
| Three samples of known concentration were tested in twenty assays to assess. |
|
|
|
| |
|
|
|
|
|
|
|
|
| Linearity |
| To assess the linearity of the assay, samples were spiked with high concentrations of human VEGF-C in various matrices and diluted with the Sample Diluent to produce samples with values within the dynamic range of the assay. |
|
| |
Sample |
Serum(n=4) |
|
|
| 1:1 |
Average % |
100 |
|
|
| Range % |
96-105 |
|
|
| 1:2 |
Average % |
92 |
|
|
| Range % |
87-99 |
|
|
| 1:4 |
Average % |
95 |
|
|
| Range % |
90-101 |
|
|
| 1:8 |
Average % |
92 |
|
|
| Range % |
88-96 |
|
|
|
| Recovery |
| The recovery of human VEGF-C spiked to levels throughout the range of the assay in various matrices was evaluated. Samples were diluted prior to assay as directed in the Sample Preparation section. |
|
| |
| Sample Type |
Average % Recovery |
Range |
|
|
| Serum (n=5) |
99 |
94-106 |
|
|
| EDTA plasma (n=4) |
90 |
84-96 |
|
|
| |
|
|
|
|
|
|
|
| |
|
|
|
|
|
|
|
|
| Typical Data |
| These standard curves are provided for demonstration only. A standard curve should be generated for each set of samples assayed. |
|
| |
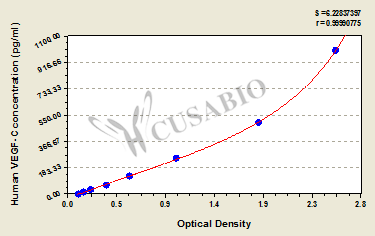
| pg/ml |
OD1 |
OD2 |
Average |
Corrected |
|
|
| 1000 |
2.575 |
2.543 |
2.559 |
2.446 |
|
|
| 500 |
1.880 |
1.776 |
1.828 |
1.715 |
|
|
| 250 |
1.051 |
1.034 |
1.043 |
0.930 |
|
|
| 125 |
0.613 |
0.587 |
0.600 |
0.487 |
|
|
| 62.5 |
0.387 |
0.371 |
0.379 |
0.266 |
|
|
| 31.2 |
0.235 |
0.226 |
0.231 |
0.118 |
|
|
| 15.6 |
0.169 |
0.158 |
0.164 |
0.051 |
|
|
| 0 |
0.115 |
0.111 |
0.113 |
|
|
|
|
|
| Storage |
Store at 2-8°C. Please refer to protocol. |
| Lead Time |
3-5 working days |