Mouse Interleukin 5,IL-5 ELISA KIT
Product Details
| Target Name |
interleukin 5 (colony-stimulating factor, eosinophil) |
| Alternative Names |
Il5 ELISA Kit; Il-5Interleukin-5 ELISA Kit; IL-5 ELISA Kit; B-cell growth factor II ELISA Kit; BCGF-II ELISA Kit; Cytotoxic T-lymphocyte inducer ELISA Kit; Eosinophil differentiation factor ELISA Kit; T-cell replacing factor ELISA Kit; TRF ELISA Kit |
| Abbreviation |
IL5 |
| Uniprot No. |
P04401 |
| Species |
Mus musculus (Mouse) |
| Sample Types |
serum, plasma, cell culture supernates, tissue homogenates |
| Detection Range |
31.25 pg/mL-2000 pg/mL |
| Sensitivity |
7.8 pg/mL |
| Assay Time |
1-5h |
| Sample Volume |
50-100ul |
| Detection Wavelength |
450 nm |
| Research Area |
Immunology |
| Assay Principle |
quantitative |
| Measurement |
Sandwich |
| Precision |
| Intra-assay Precision (Precision within an assay): CV% |
| Three samples of known concentration were tested twenty times on one plate to assess. |
|
| Inter-assay Precision (Precision between assays): CV% |
| Three samples of known concentration were tested in twenty assays to assess. |
|
|
| |
|
|
|
|
|
|
|
| Linearity |
| To assess the linearity of the assay, samples were spiked with high concentrations of mouse IL-5 in various matrices and diluted with the Sample Diluent to produce samples with values within the dynamic range of the assay. |
| |
Sample |
Serum(n=4) |
|
| 1:1 |
Average % |
85 |
|
| Range % |
80-90 |
|
| 1:2 |
Average % |
99 |
|
| Range % |
93-105 |
|
| 1:4 |
Average % |
97 |
|
| Range % |
92-102 |
|
| 1:8 |
Average % |
95 |
|
| Range % |
91-101 |
|
|
| Recovery |
| The recovery of mouse IL-5 spiked to levels throughout the range of the assay in various matrices was evaluated. Samples were diluted prior to assay as directed in the Sample Preparation section. |
| Sample Type |
Average % Recovery |
Range |
|
| Serum (n=5) |
92 |
86-99 |
|
| EDTA plasma (n=4) |
95 |
90-100 |
|
| |
|
|
|
|
|
|
| |
|
|
|
|
|
|
|
| Typical Data |
| These standard curves are provided for demonstration only. A standard curve should be generated for each set of samples assayed. |
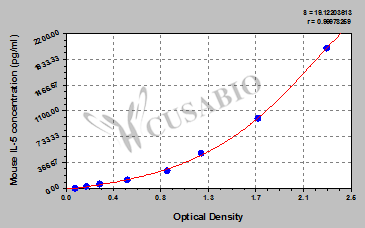
| pg/ml |
OD1 |
OD2 |
Average |
Corrected |
|
| 2000 |
2.336 |
2.252 |
2.294 |
2.203 |
|
| 1000 |
1.699 |
1.686 |
1.693 |
1.602 |
|
| 500 |
1.247 |
1.148 |
1.198 |
1.107 |
|
| 250 |
0.913 |
0.877 |
0.895 |
0.804 |
|
| 125 |
0.571 |
0.525 |
0.548 |
0.457 |
|
| 62.5 |
0.315 |
0.294 |
0.305 |
0.214 |
|
| 31.25 |
0.198 |
0.184 |
0.191 |
0.100 |
|
| 0 |
0.092 |
0.090 |
0.091 |
|
|
|
|
| Storage |
Store at 2-8°C. Please refer to protocol. |
| Lead Time |
3-5 working days |