Mouse Kidney injury molecule 1,Kim-1 ELISA Kit
Product Details
| Target Name |
hepatitis A virus cellular receptor 1 |
| Alternative Names |
Havcr1 ELISA Kit; Kim1 ELISA Kit; Tim1 ELISA Kit; Timd1 ELISA Kit; Hepatitis A virus cellular receptor 1 homolog ELISA Kit; HAVcr-1 ELISA Kit; Kidney injury molecule 1 ELISA Kit; KIM-1 ELISA Kit; T cell immunoglobulin and mucin domain-containing protein 1 ELISA Kit; TIMD-1 ELISA Kit; T cell membrane protein 1 ELISA Kit; T-cell immunoglobulin mucin receptor 1 ELISA Kit; TIM-1 ELISA Kit; CD antigen CD365 ELISA Kit |
| Abbreviation |
HAVCR1 |
| Species |
Mus musculus (Mouse) |
| Sample Types |
serum, plasma, tissue homogenates, urine |
| Detection Range |
0.9 ng/mL-60 ng/mL |
| Sensitivity |
0.225 ng/mL |
| Assay Time |
1-5h |
| Sample Volume |
50-100ul |
| Detection Wavelength |
450 nm |
| Research Area |
Microbiology |
| Assay Principle |
quantitative |
| Measurement |
Sandwich |
| Precision |
| Intra-assay Precision (Precision within an assay): CV% |
| Three samples of known concentration were tested twenty times on one plate to assess. |
|
| Inter-assay Precision (Precision between assays): CV% |
| Three samples of known concentration were tested in twenty assays to assess. |
|
|
| |
|
|
|
|
|
|
|
| Linearity |
| To assess the linearity of the assay, samples were spiked with high concentrations of mouse Kim-1 in various matrices and diluted with the Sample Diluent to produce samples with values within the dynamic range of the assay. |
| |
Sample |
Serum(n=4) |
|
| 1:1 |
Average % |
93 |
|
| Range % |
87-99 |
|
| 1:2 |
Average % |
92 |
|
| Range % |
88-98 |
|
| 1:4 |
Average % |
96 |
|
| Range % |
90-101 |
|
| 1:8 |
Average % |
95 |
|
| Range % |
92-99 |
|
|
| Recovery |
| The recovery of mouse Kim-1 spiked to levels throughout the range of the assay in various matrices was evaluated. Samples were diluted prior to assay as directed in the Sample Preparation section. |
| Sample Type |
Average % Recovery |
Range |
|
| Serum (n=5) |
93 |
89-97 |
|
| EDTA plasma (n=4) |
94 |
88-99 |
|
| |
|
|
|
|
|
|
| |
|
|
|
|
|
|
|
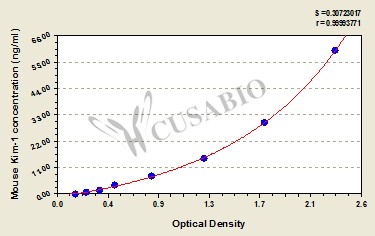
| Typical Data |
| These standard curves are provided for demonstration only. A standard curve should be generated for each set of samples assayed. |
| ng/ml |
OD1 |
OD2 |
Average |
Corrected |
|
| 60 |
2.356 |
2.345 |
2.351 |
2.183 |
|
| 30 |
1.786 |
1.725 |
1.756 |
1.588 |
|
| 15 |
1.264 |
1.236 |
1.250 |
1.082 |
|
| 7.5 |
0.813 |
0.801 |
0.807 |
0.639 |
|
| 3.75 |
0.513 |
0.489 |
0.501 |
0.333 |
|
| 1.8 |
0.378 |
0.363 |
0.371 |
0.203 |
|
| 0.9 |
0.267 |
0.251 |
0.259 |
0.091 |
|
| 0 |
0.170 |
0.166 |
0.168 |
|
|
|
|
| Storage |
Store at 2-8°C. Please refer to protocol. |
| Lead Time |
3-5 working days |