Mouse lipoprotein-associated phospholipase A2,Lp-PLA2 ELISA Kit
Product Details
| Alternative Names |
Pla2g7 ELISA Kit; Pafah ELISA Kit; Platelet-activating factor acetylhydrolase ELISA Kit; PAF acetylhydrolase ELISA Kit; EC 3.1.1.47 ELISA Kit; 1-alkyl-2-acetylglycerophosphocholine esterase ELISA Kit; 2-acetyl-1-alkylglycerophosphocholine esterase ELISA Kit; LDL-associated phospholipase A2 ELISA Kit; LDL-PLA(2) ELISA Kit; PAF 2-acylhydrolase ELISA Kit |
| Abbreviation |
PLA2G7 |
| Species |
Mus musculus (Mouse) |
| Sample Types |
serum, plasma, cell culture supernates, tissue homogenates |
| Detection Range |
7.8 pg/mL-500 pg/mL |
| Sensitivity |
1.95 pg/mL |
| Assay Time |
1-5h |
| Sample Volume |
50-100ul |
| Detection Wavelength |
450 nm |
| Research Area |
Metabolism |
| Assay Principle |
quantitative |
| Measurement |
Sandwich |
| Precision |
| Intra-assay Precision (Precision within an assay): CV% |
| Three samples of known concentration were tested twenty times on one plate to assess. |
|
| Inter-assay Precision (Precision between assays): CV% |
| Three samples of known concentration were tested in twenty assays to assess. |
|
|
| |
|
|
|
|
|
|
|
| Linearity |
| To assess the linearity of the assay, samples were spiked with high concentrations of mouse Lp-PLA2 in various matrices and diluted with the Sample Diluent to produce samples with values within the dynamic range of the assay. |
| |
Sample |
Serum(n=4) |
|
| 1:100 |
Average % |
92 |
|
| Range % |
87-102 |
|
| 1:200 |
Average % |
95 |
|
| Range % |
84-107 |
|
| 1:400 |
Average % |
95 |
|
| Range % |
83-102 |
|
| 1:800 |
Average % |
96 |
|
| Range % |
84-105 |
|
|
| Recovery |
| The recovery of mouse Lp-PLA2 spiked to levels throughout the range of the assay in various matrices was evaluated. Samples were diluted prior to assay as directed in the Sample Preparation section. |
| Sample Type |
Average % Recovery |
Range |
|
| Serum (n=5) |
97 |
86-105 |
|
| EDTA plasma (n=4) |
96 |
88-109 |
|
| |
|
|
|
|
|
|
| |
|
|
|
|
|
|
|
| Typical Data |
| These standard curves are provided for demonstration only. A standard curve should be generated for each set of samples assayed. |
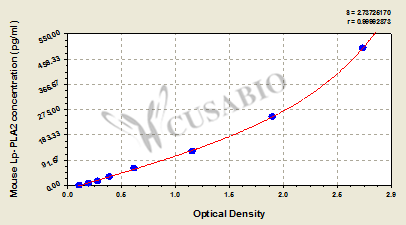
| pg/ml |
OD1 |
OD2 |
Average |
Corrected |
|
| 500 |
2.715 |
2.652 |
2.684 |
2.565 |
|
| 250 |
1.817 |
1.913 |
1.865 |
1.746 |
|
| 125 |
1.113 |
1.165 |
1.139 |
1.020 |
|
| 62.5 |
0.600 |
0.627 |
0.614 |
0.495 |
|
| 31.2 |
0.380 |
0.393 |
0.387 |
0.268 |
|
| 15.6 |
0.273 |
0.292 |
0.283 |
0.164 |
|
| 7.8 |
0.192 |
0.202 |
0.197 |
0.078 |
|
| 0 |
0.116 |
0.122 |
0.119 |
|
|
|
|
| Storage |
Store at 2-8°C. Please refer to protocol. |
| Lead Time |
3-5 working days |