Mouse pigment epithelium-derived factor,PEDF ELISA Kit
Product Details
| Target Name |
serpin peptidase inhibitor, clade F (alpha-2 antiplasmin, pigment epithelium derived factor), member 1 |
| Alternative Names |
Serpinf1 ELISA Kit; Pedf ELISA Kit; Sdf3Pigment epithelium-derived factor ELISA Kit; PEDF ELISA Kit; Caspin ELISA Kit; Serpin F1 ELISA Kit; Stromal cell-derived factor 3 ELISA Kit; SDF-3 ELISA Kit |
| Abbreviation |
SERPINF1 |
| Species |
Mus musculus (Mouse) |
| Sample Types |
serum, plasma, tissue homogenates, cell culture supernates |
| Detection Range |
15.6 pg/mL-1000 pg/mL |
| Sensitivity |
3.9 pg/mL |
| Assay Time |
1-5h |
| Sample Volume |
50-100ul |
| Detection Wavelength |
450 nm |
| Research Area |
Others |
| Assay Principle |
quantitative |
| Measurement |
Sandwich |
| Precision |
| Intra-assay Precision (Precision within an assay): CV% |
| Three samples of known concentration were tested twenty times on one plate to assess. |
|
| Inter-assay Precision (Precision between assays): CV% |
| Three samples of known concentration were tested in twenty assays to assess. |
|
|
| |
|
|
|
|
|
|
|
| Linearity |
| To assess the linearity of the assay, samples were spiked with high concentrations of mouse PEDF in various matrices and diluted with the Sample Diluent to produce samples with values within the dynamic range of the assay. |
| |
Sample |
Serum(n=4) |
|
| 1:1 |
Average % |
85 |
|
| Range % |
80-90 |
|
| 1:2 |
Average % |
95 |
|
| Range % |
90-100 |
|
| 1:4 |
Average % |
94 |
|
| Range % |
88-99 |
|
| 1:8 |
Average % |
94 |
|
| Range % |
90-100 |
|
|
| Recovery |
| The recovery of mouse PEDF spiked to levels throughout the range of the assay in various matrices was evaluated. Samples were diluted prior to assay as directed in the Sample Preparation section. |
| Sample Type |
Average % Recovery |
Range |
|
| Serum (n=5) |
95 |
90-102 |
|
| EDTA plasma (n=4) |
99 |
92-104 |
|
| |
|
|
|
|
|
|
| |
|
|
|
|
|
|
|
| Typical Data |
| These standard curves are provided for demonstration only. A standard curve should be generated for each set of samples assayed. |
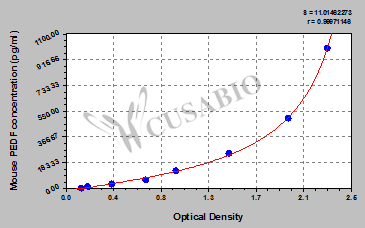
| pg/ml |
OD1 |
OD2 |
Average |
Corrected |
|
| 1000 |
2.334 |
2.217 |
2.276 |
2.129 |
|
| 500 |
1.987 |
1.891 |
1.939 |
1.792 |
|
| 250 |
1.436 |
1.414 |
1.425 |
1.278 |
|
| 125 |
1.005 |
0.926 |
0.966 |
0.819 |
|
| 62.5 |
0.718 |
0.698 |
0.708 |
0.561 |
|
| 31.2 |
0.422 |
0.402 |
0.412 |
0.265 |
|
| 15.6 |
0.203 |
0.201 |
0.202 |
0.055 |
|
| 0 |
0.151 |
0.143 |
0.147 |
|
|
|
|
| Storage |
Store at 2-8°C. Please refer to protocol. |
| Lead Time |
3-5 working days |