Mouse Vascular endothelial cell growth factor receptor 2,VEGFR-2/Flk-1 ELISA kit
Product Details
| Target Name |
kinase insert domain receptor (a type III receptor tyrosine kinase) |
| Alternative Names |
Kdr ELISA Kit; Flk-1 ELISA Kit; Flk1 ELISA Kit; Vascular endothelial growth factor receptor 2 ELISA Kit; VEGFR-2 ELISA Kit; EC 2.7.10.1 ELISA Kit; Fetal liver kinase 1 ELISA Kit; FLK-1 ELISA Kit; Kinase NYK ELISA Kit; Protein-tyrosine kinase receptor flk-1 ELISA Kit; CD antigen CD309 ELISA Kit |
| Abbreviation |
VEGFR-2/Flk-1 |
| Species |
Mus musculus (Mouse) |
| Sample Types |
serum, plasma |
| Detection Range |
7.8 pg/mL-500 pg/mL |
| Sensitivity |
1.95 pg/mL |
| Assay Time |
1-5h |
| Sample Volume |
50-100ul |
| Detection Wavelength |
450 nm |
| Research Area |
Cancer |
| Assay Principle |
quantitative |
| Measurement |
Sandwich |
| Precision |
| Intra-assay Precision (Precision within an assay): CV% |
|
|
|
|
| Three samples of known concentration were tested twenty times on one plate to assess. |
|
|
| Inter-assay Precision (Precision between assays): CV% |
|
|
|
|
| Three samples of known concentration were tested in twenty assays to assess. |
|
|
|
| |
|
|
|
|
|
|
|
|
| Linearity |
| To assess the linearity of the assay, samples were spiked with high concentrations of mouse VEGFR-2/Flk-1 in various matrices and diluted with the Sample Diluent to produce samples with values within the dynamic range of the assay. |
|
| |
Sample |
Serum(n=4) |
|
|
| 1:100 |
Average % |
86 |
|
|
| Range % |
82-91 |
|
|
| 1:200 |
Average % |
101 |
|
|
| Range % |
98-105 |
|
|
| 1:400 |
Average % |
87 |
|
|
| Range % |
84-91 |
|
|
| 1:800 |
Average % |
100 |
|
|
| Range % |
95-105 |
|
|
|
| Recovery |
| The recovery of mouse VEGFR-2/Flk-1 spiked to levels throughout the range of the assay in various matrices was evaluated. Samples were diluted prior to assay as directed in the Sample Preparation section. |
|
| |
| Sample Type |
Average % Recovery |
Range |
|
|
| Serum (n=5) |
89 |
85-94 |
|
|
| EDTA plasma (n=4) |
107 |
103-110 |
|
|
| |
|
|
|
|
|
|
|
| |
|
|
|
|
|
|
|
|
| Typical Data |
| These standard curves are provided for demonstration only. A standard curve should be generated for each set of samples assayed. |
|
| |
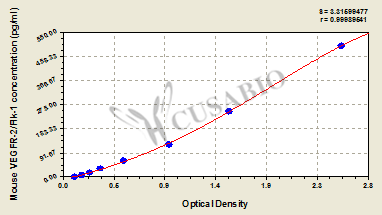
| pg/ml |
OD1 |
OD2 |
Average |
Corrected |
|
|
| 500 |
2.564 |
2.536 |
2.550 |
2.438 |
|
|
| 250 |
1.513 |
1.531 |
1.522 |
1.410 |
|
|
| 125 |
0.985 |
0.961 |
0.973 |
0.861 |
|
|
| 62.5 |
0.551 |
0.560 |
0.556 |
0.444 |
|
|
| 31.2 |
0.345 |
0.351 |
0.348 |
0.236 |
|
|
| 15.6 |
0.242 |
0.251 |
0.247 |
0.135 |
|
|
| 7.8 |
0.174 |
0.176 |
0.175 |
0.063 |
|
|
| 0 |
0.113 |
0.110 |
0.112 |
|
|
|
|
|
| Storage |
Store at 2-8°C. Please refer to protocol. |