Rat Amyloid beta A4 protein(APP) ELISA kit
Product Details
| Target Name |
amyloid beta (A4) precursor protein |
| Alternative Names |
AppAmyloid-beta A4 protein ELISA kit; ABPP ELISA kit; APP ELISA kit; Alzheimer disease amyloid A4 protein homolog ELISA kit; Amyloid precursor protein ELISA kit; Amyloid-beta precursor protein ELISA kit; Amyloidogenic glycoprotein ELISA kit; AG) [Cleaved into: N-APP; Soluble APP-alpha ELISA kit; S-APP-alpha); Soluble APP-beta ELISA kit; S-APP-beta); C99 ELISA kit; Beta-secretase C-terminal fragment ELISA kit; Beta-CTF); Amyloid-beta protein 42 ELISA kit; Abeta42 ELISA kit; Beta-APP42); Amyloid-beta protein 40 ELISA kit; Abeta40 ELISA kit; Beta-APP40); C83 ELISA kit; Alpha-secretase C-terminal fragment ELISA kit; Alpha-CTF); P3(42); P3(40); C80; Gamma-secretase C-terminal fragment 59 ELISA kit; Gamma-CTF(59)); Gamma-secretase C-terminal fragment 57 ELISA kit; Gamma-CTF(57)); Gamma-secretase C-terminal fragment 50 ELISA kit; Gamma-CTF(50)); C31] ELISA kit |
| Abbreviation |
APP |
| Species |
Rattus norvegicus (Rat) |
| Sample Types |
serum, plasma, tissue homogenates |
| Detection Range |
15.6 ng/mL-1000 ng/mL |
| Sensitivity |
3.9 ng/mL |
| Assay Time |
1-5h |
| Sample Volume |
50-100ul |
| Detection Wavelength |
450 nm |
| Research Area |
Neuroscience |
| Assay Principle |
quantitative |
| Measurement |
Sandwich |
| Precision |
| Intra-assay Precision (Precision within an assay): CV% |
| Three samples of known concentration were tested twenty times on one plate to assess. |
|
| Inter-assay Precision (Precision between assays): CV% |
| Three samples of known concentration were tested in twenty assays to assess. |
|
|
| |
|
|
|
|
|
|
|
| Linearity |
| To assess the linearity of the assay, samples were spiked with high concentrations of rat APP in various matrices and diluted with the Sample Diluent to produce samples with values within the dynamic range of the assay. |
| |
Sample |
Serum(n=4) |
|
| 1:1 |
Average % |
84 |
|
| Range % |
80-92 |
|
| 1:2 |
Average % |
92 |
|
| Range % |
88-99 |
|
| 1:4 |
Average % |
100 |
|
| Range % |
95-107 |
|
| 1:8 |
Average % |
90 |
|
| Range % |
86-95 |
|
|
| Recovery |
| The recovery of rat APP spiked to levels throughout the range of the assay in various matrices was evaluated. Samples were diluted prior to assay as directed in the Sample Preparation section. |
| Sample Type |
Average % Recovery |
Range |
|
| Serum (n=5) |
93 |
87-97 |
|
| EDTA plasma (n=4) |
95 |
90-101 |
|
| |
|
|
|
|
|
|
| |
|
|
|
|
|
|
|
| Typical Data |
| These standard curves are provided for demonstration only. A standard curve should be generated for each set of samples assayed. |
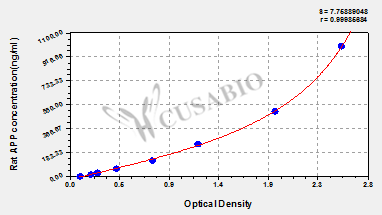
| ng/ml |
OD1 |
OD2 |
Average |
Corrected |
|
| 1000 |
2.557 |
2.520 |
2.539 |
2.429 |
|
| 500 |
1.961 |
1.876 |
1.919 |
1.809 |
|
| 250 |
1.197 |
1.204 |
1.201 |
1.091 |
|
| 125 |
0.748 |
0.809 |
0.779 |
0.669 |
|
| 62.5 |
0.436 |
0.446 |
0.441 |
0.331 |
|
| 31.2 |
0.278 |
0.259 |
0.269 |
0.159 |
|
| 15.6 |
0.206 |
0.209 |
0.208 |
0.098 |
|
| 0 |
0.112 |
0.107 |
0.110 |
|
|
|
|
| Storage |
Store at 2-8°C. Please refer to protocol. |
| Lead Time |
5-7 working days |