| Target Name |
C-Peptide |
| Abbreviation |
C-Peptide |
| Species |
Rattus norvegicus (Rat) |
| Sample Types |
serum, plasma, tissue homogenates |
| Detection Range |
1.25 ng/mL-20 ng/mL |
| Sensitivity |
1.25 ng/mL |
| Assay Time |
1-5h |
| Sample Volume |
50-100ul |
| Detection Wavelength |
450 nm |
| Research Area |
Metabolism |
| Assay Principle |
quantitative |
| Measurement |
Competitive |
| Precision |
| Intra-assay Precision (Precision within an assay): CV% |
| Three samples of known concentration were tested twenty times on one plate to assess. |
|
| Inter-assay Precision (Precision between assays): CV% |
| Three samples of known concentration were tested in twenty assays to assess. |
|
|
| |
|
|
|
|
|
|
|
| Linearity |
| To assess the linearity of the assay, samples were spiked with high concentrations of rat C-peptide in various matrices and diluted with the Sample Diluent to produce samples with values within the dynamic range of the assay. |
| |
Sample |
Serum(n=4) |
|
| 1:1 |
Average % |
99 |
|
| Range % |
93-103 |
|
| 1:2 |
Average % |
90 |
|
| Range % |
85-94 |
|
| 1:4 |
Average % |
84 |
|
| Range % |
80-88 |
|
| 1:8 |
Average % |
93 |
|
| Range % |
86-98 |
|
|
| Recovery |
| The recovery of rat C-peptide spiked to levels throughout the range of the assay in various matrices was evaluated. Samples were diluted prior to assay as directed in the Sample Preparation section. |
| Sample Type |
Average % Recovery |
Range |
|
| Serum (n=5) |
92 |
88-96 |
|
| EDTA plasma (n=4) |
96 |
91-102 |
|
| |
|
|
|
|
|
|
| |
|
|
|
|
|
|
|
| Typical Data |
| These standard curves are provided for demonstration only. A standard curve should be generated for each set of samples assayed. |
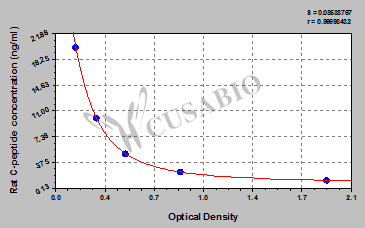
| ng/ml |
OD1 |
OD2 |
Average |
|
|
| 20 |
0.155 |
0.151 |
0.153 |
|
|
| 10 |
0.289 |
0.304 |
0.297 |
|
|
| 5 |
0.501 |
0.491 |
0.496 |
|
|
| 2.5 |
0.847 |
0.912 |
0.880 |
|
|
| 1.25 |
1.954 |
1.826 |
1.890 |
|
|
|
|
| Storage |
Store at 2-8°C. Please refer to protocol. |
| Lead Time |
3-5 working days |