Rat cyclooxygenase-2,COX-2 ELISA Kit
Product Details
| Target Name |
prostaglandin-endoperoxide synthase 2 (prostaglandin G/H synthase and cyclooxygenase) |
| Alternative Names |
Ptgs2 ELISA Kit; Cox-2 ELISA Kit; Cox2 ELISA Kit; Prostaglandin G/H synthase 2 ELISA Kit; EC 1.14.99.1 ELISA Kit; Cyclooxygenase-2 ELISA Kit; COX-2 ELISA Kit; PHS II ELISA Kit; Prostaglandin H2 synthase 2 ELISA Kit; PGH synthase 2 ELISA Kit; PGHS-2 ELISA Kit; Prostaglandin-endoperoxide synthase 2 ELISA Kit |
| Abbreviation |
PTGS2 |
| Species |
Rattus norvegicus (Rat) |
| Sample Types |
serum, plasma, tissue homogenates |
| Detection Range |
1.56 ng/mL-100 ng/mL |
| Sensitivity |
0.39 ng/mL |
| Assay Time |
1-5h |
| Sample Volume |
50-100ul |
| Detection Wavelength |
450 nm |
| Research Area |
Metabolism |
| Assay Principle |
quantitative |
| Measurement |
Sandwich |
| Precision |
| Intra-assay Precision (Precision within an assay): CV% |
| Three samples of known concentration were tested twenty times on one plate to assess. |
|
| Inter-assay Precision (Precision between assays): CV% |
| Three samples of known concentration were tested in twenty assays to assess. |
|
|
| |
|
|
|
|
|
|
|
| Linearity |
| To assess the linearity of the assay, samples were spiked with high concentrations of rat COX-2 in various matrices and diluted with the Sample Diluent to produce samples with values within the dynamic range of the assay. |
| |
Sample |
Serum(n=4) |
|
| 1:1 |
Average % |
98 |
|
| Range % |
92-106 |
|
| 1:2 |
Average % |
95 |
|
| Range % |
91-99 |
|
| 1:4 |
Average % |
92 |
|
| Range % |
88-96 |
|
| 1:8 |
Average % |
85 |
|
| Range % |
80-89 |
|
|
| Recovery |
| The recovery of rat COX-2 spiked to levels throughout the range of the assay in various matrices was evaluated. Samples were diluted prior to assay as directed in the Sample Preparation section. |
| Sample Type |
Average % Recovery |
Range |
|
| Serum (n=5) |
92 |
88-98 |
|
| EDTA plasma (n=4) |
94 |
90-98 |
|
| |
|
|
|
|
|
|
| |
|
|
|
|
|
|
|
| Typical Data |
| These standard curves are provided for demonstration only. A standard curve should be generated for each set of samples assayed. |
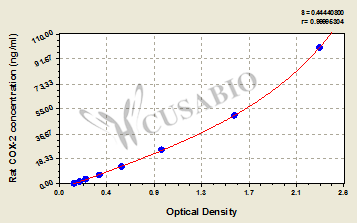
| ng/ml |
OD1 |
OD2 |
Average |
Corrected |
|
| 100 |
2.386 |
2.285 |
2.336 |
2.191 |
|
| 50 |
1.628 |
1.527 |
1.578 |
1.433 |
|
| 25 |
0.937 |
0.916 |
0.927 |
0.782 |
|
| 12.5 |
0.564 |
0.575 |
0.570 |
0.425 |
|
| 6.25 |
0.365 |
0.376 |
0.371 |
0.226 |
|
| 3.12 |
0.240 |
0.251 |
0.246 |
0.101 |
|
| 1.56 |
0.195 |
0.191 |
0.193 |
0.048 |
|
| 0 |
0.145 |
0.144 |
0.145 |
|
|
|
|
| Storage |
Store at 2-8°C. Please refer to protocol. |
| Lead Time |
3-5 working days |