Rat soluble receptor activator of nuclear factor-kB ligand,sRANKL ELISA Kit
Product Details
| Target Name |
tumor necrosis factor (ligand) superfamily, member 11 |
| Alternative Names |
Tnfsf11 ELISA Kit; Opgl ELISA Kit; Rankl ELISA Kit; Trance ELISA Kit; Tumor necrosis factor ligand superfamily member 11 ELISA Kit; Osteoclast differentiation factor ELISA Kit; ODF ELISA Kit; Osteoprotegerin ligand ELISA Kit; OPGL ELISA Kit; Receptor activator of nuclear factor kappa-B ligand ELISA Kit; RANKL ELISA Kit; TNF-related activation-induced cytokine ELISA Kit; TRANCE ELISA Kit; CD antigen CD254) [Cleaved into: Tumor necrosis factor ligand superfamily member 11 ELISA Kit; membrane form; Tumor necrosis factor ligand superfamily member 11 ELISA Kit; soluble form] ELISA Kit |
| Abbreviation |
TNFSF11 |
| Uniprot No. |
O35235 |
| Species |
Mus musculus (Mouse) |
| Sample Types |
serum, plasma, cell culture supernates, tissue homogenates |
| Detection Range |
15.6 pg/mL-1000 pg/mL |
| Sensitivity |
3.9 pg/mL |
| Assay Time |
1-5h |
| Sample Volume |
50-100ul |
| Detection Wavelength |
450 nm |
| Research Area |
Cardiovascular |
| Assay Principle |
quantitative |
| Measurement |
Sandwich |
| Precision |
| Intra-assay Precision (Precision within an assay): CV% |
| Three samples of known concentration were tested twenty times on one plate to assess. |
|
| Inter-assay Precision (Precision between assays): CV% |
| Three samples of known concentration were tested in twenty assays to assess. |
|
|
| |
|
|
|
|
|
|
|
| Linearity |
| To assess the linearity of the assay, samples were spiked with high concentrations of mouse sRANKL in various matrices and diluted with the Sample Diluent to produce samples with values within the dynamic range of the assay. |
| |
Sample |
Serum(n=4) |
|
| 1:100 |
Average % |
90 |
|
| Range % |
86-93 |
|
| 1:200 |
Average % |
103 |
|
| Range % |
99-105 |
|
| 1:400 |
Average % |
94 |
|
| Range % |
88-97 |
|
| 1:800 |
Average % |
97 |
|
| Range % |
92-100 |
|
|
| Recovery |
| The recovery of mouse sRANKL spiked to levels throughout the range of the assay in various matrices was evaluated. Samples were diluted prior to assay as directed in the Sample Preparation section. |
| Sample Type |
Average % Recovery |
Range |
|
| Serum (n=5) |
95 |
89-97 |
|
| EDTA plasma (n=4) |
95 |
91-98 |
|
| |
|
|
|
|
|
|
| |
|
|
|
|
|
|
|
| Typical Data |
| These standard curves are provided for demonstration only. A standard curve should be generated for each set of samples assayed. |
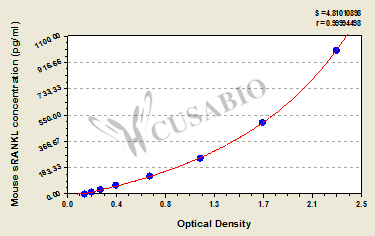
| pg/ml |
OD1 |
OD2 |
Average |
Corrected |
|
| 1000 |
2.284 |
2.262 |
2.273 |
2.120 |
|
| 500 |
1.665 |
1.646 |
1.656 |
1.503 |
|
| 250 |
1.137 |
1.122 |
1.130 |
0.977 |
|
| 125 |
0.712 |
0.700 |
0.706 |
0.553 |
|
| 62.5 |
0.417 |
0.422 |
0.420 |
0.267 |
|
| 31.2 |
0.295 |
0.282 |
0.289 |
0.136 |
|
| 15.6 |
0.212 |
0.222 |
0.217 |
0.064 |
|
| 0 |
0.156 |
0.150 |
0.153 |
|
|
|
|
| Storage |
Store at 2-8°C. Please refer to protocol. |
| Lead Time |
3-5 working days |