Rat Sterol regulatory element-binding protein 1C(SREBP-1C) ELISA Kit
Product Details
| Target Name |
Sterol regulatory element-binding protein 1C(SREBP-1C) |
| Alternative Names |
Srebf1 ELISA Kit; Srebp1 ELISA Kit; Sterol regulatory element-binding protein 1 ELISA Kit; SREBP-1 ELISA Kit; Adipocyte determination- and differentiation-dependent factor 1 ELISA Kit; ADD1 ELISA Kit; Sterol regulatory element-binding transcription factor 1) [Cleaved into: Processed sterol regulatory element-binding protein 1] ELISA Kit |
| Abbreviation |
SREBP-1C |
| Species |
Rattus norvegicus (Rat) |
| Sample Types |
serum, plasma, tissue homogenates |
| Detection Range |
62.5 pg/mL-4000 pg/mL |
| Sensitivity |
15.6 pg/mL |
| Assay Time |
1-5h |
| Sample Volume |
50-100ul |
| Detection Wavelength |
450 nm |
| Research Area |
Metabolism |
| Assay Principle |
quantitative |
| Measurement |
Sandwich |
| Precision |
| Intra-assay Precision (Precision within an assay): CV% |
| Three samples of known concentration were tested twenty times on one plate to assess. |
|
| Inter-assay Precision (Precision between assays): CV% |
| Three samples of known concentration were tested in twenty assays to assess. |
|
|
| |
|
|
|
|
|
|
|
| Linearity |
| To assess the linearity of the assay, samples were spiked with high concentrations of rat SREBP-1C in various matrices and diluted with the Sample Diluent to produce samples with values within the dynamic range of the assay. |
| |
Sample |
Serum(n=4) |
|
| 1:5 |
Average % |
90 |
|
| Range % |
86-96 |
|
| 1:10 |
Average % |
101 |
|
| Range % |
95-108 |
|
| 1:20 |
Average % |
95 |
|
| Range % |
90-100 |
|
| 1:40 |
Average % |
92 |
|
| Range % |
87-96 |
|
|
| Recovery |
| The recovery of rat SREBP-1C spiked to levels throughout the range of the assay in various matrices was evaluated. Samples were diluted prior to assay as directed in the Sample Preparation section. |
| Sample Type |
Average % Recovery |
Range |
|
| Serum (n=5) |
93 |
90-96 |
|
| EDTA plasma (n=4) |
96 |
90-102 |
|
| |
|
|
|
|
|
|
| |
|
|
|
|
|
|
|
| Typical Data |
| These standard curves are provided for demonstration only. A standard curve should be generated for each set of samples assayed. |
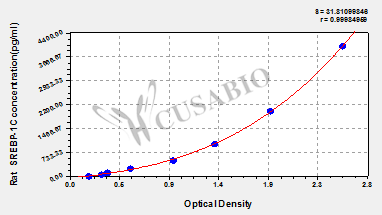
| pg/ml |
OD1 |
OD2 |
Average |
Corrected |
|
| 4000 |
2.538 |
2.569 |
2.554 |
2.356 |
|
| 2000 |
1.898 |
1.866 |
1.882 |
1.684 |
|
| 1000 |
1.381 |
1.351 |
1.366 |
1.168 |
|
| 500 |
0.959 |
0.999 |
0.979 |
0.781 |
|
| 250 |
0.574 |
0.587 |
0.581 |
0.383 |
|
| 125 |
0.364 |
0.381 |
0.373 |
0.175 |
|
| 62.5 |
0.304 |
0.328 |
0.316 |
0.118 |
|
| 0 |
0.196 |
0.200 |
0.198 |
|
|
|
|
| Storage |
Store at 2-8°C. Please refer to protocol. |
| Lead Time |
3-5 working days |